OPEN-SOURCE SCRIPT
업데이트됨 VSA Signals [odnac]
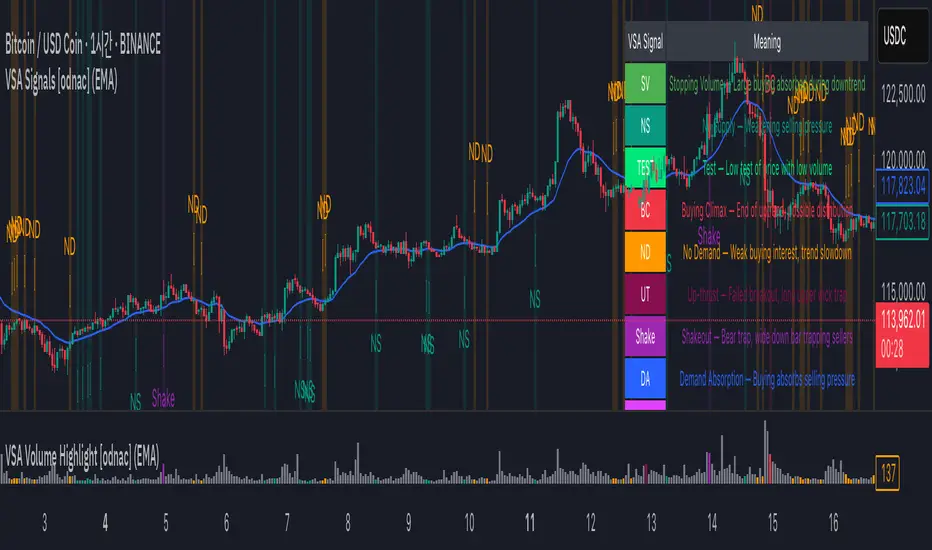
This indicator applies Volume Spread Analysis (VSA) concepts to highlight important supply and demand events directly on the chart. It automatically detects common VSA patterns using price spread, relative volume, and candle structure, with optional trend filtering for higher accuracy.
Features:
Additional Options:
This tool is designed to help traders spot professional accumulation and distribution activity and to improve trade timing by recognizing supply/demand imbalances in the market.
Features:
- Stopping Volume (SV): Signals potential end of a downtrend when heavy buying appears.
- Buying Climax (BC): Indicates exhaustion of an uptrend with heavy volume near the top.
- No Supply (NS): Weak selling pressure, often a bullish sign in an uptrend.
- No Demand (ND): Weak buying interest, often a bearish sign in a downtrend.
- Test: Low-volume test bar probing for supply.
- Up-thrust (UT): Failed breakout with long upper wick, often a bearish trap.
- Shakeout: Bear trap with high-volume wide down bar closing low.
- Demand Absorption (DA): Demand absorbing heavy selling pressure.
- Supply Absorption (SA): Supply absorbing heavy buying pressure.
Additional Options:
- Background highlights for detected signals.
- Configurable moving average (SMA, EMA, WMA, VWMA) as a trend filter.
- Adjustable multipliers for volume and spread sensitivity.
- Legend table for quick reference of signals and meanings.
- Alerts available for all signals.
This tool is designed to help traders spot professional accumulation and distribution activity and to improve trade timing by recognizing supply/demand imbalances in the market.
릴리즈 노트
- Added options to customize table position (top_left, top_right, bottom_left, bottom_right).
- Added options to adjust table font size (tiny, small, normal, large, huge).
- Minor improvements and optimizations to table display.
오픈 소스 스크립트
트레이딩뷰의 진정한 정신에 따라, 이 스크립트의 작성자는 이를 오픈소스로 공개하여 트레이더들이 기능을 검토하고 검증할 수 있도록 했습니다. 작성자에게 찬사를 보냅니다! 이 코드는 무료로 사용할 수 있지만, 코드를 재게시하는 경우 하우스 룰이 적용된다는 점을 기억하세요.
면책사항
해당 정보와 게시물은 금융, 투자, 트레이딩 또는 기타 유형의 조언이나 권장 사항으로 간주되지 않으며, 트레이딩뷰에서 제공하거나 보증하는 것이 아닙니다. 자세한 내용은 이용 약관을 참조하세요.
오픈 소스 스크립트
트레이딩뷰의 진정한 정신에 따라, 이 스크립트의 작성자는 이를 오픈소스로 공개하여 트레이더들이 기능을 검토하고 검증할 수 있도록 했습니다. 작성자에게 찬사를 보냅니다! 이 코드는 무료로 사용할 수 있지만, 코드를 재게시하는 경우 하우스 룰이 적용된다는 점을 기억하세요.
면책사항
해당 정보와 게시물은 금융, 투자, 트레이딩 또는 기타 유형의 조언이나 권장 사항으로 간주되지 않으며, 트레이딩뷰에서 제공하거나 보증하는 것이 아닙니다. 자세한 내용은 이용 약관을 참조하세요.