PROTECTED SOURCE SCRIPT
ASTA EMA (5, 13, 26, 50, 100, 200)
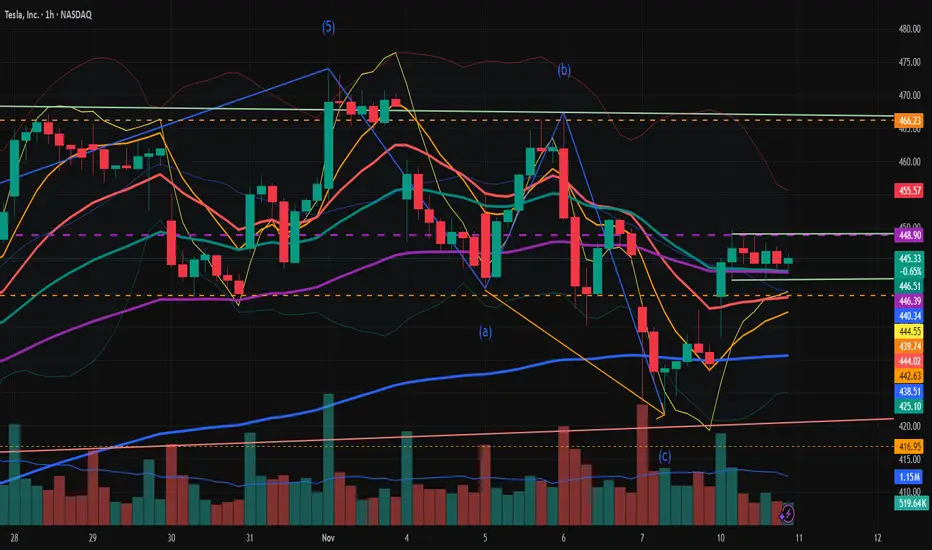
This indicator plots six Exponential Moving Averages (EMAs) — 5, 13, 26, 50, 100, and 200 — directly on the price chart. EMAs give more weight to recent price action, so they react faster than simple moving averages. Using multiple EMAs of varying lengths gives you both short-term and long-term trend information on a single chart:
Short EMAs (5, 13, 26) show rapid momentum and recent price direction.
Medium EMAs (50, 100) show intermediate trend context.
Long EMA (200) shows the major, long-term trend.
This setup is useful for trend identification, momentum signals, dynamic support/resistance, and crossover-based entry/exit signals.
보호된 스크립트입니다
이 스크립트는 비공개 소스로 게시됩니다. 하지만 이를 자유롭게 제한 없이 사용할 수 있습니다 – 자세한 내용은 여기에서 확인하세요.
면책사항
해당 정보와 게시물은 금융, 투자, 트레이딩 또는 기타 유형의 조언이나 권장 사항으로 간주되지 않으며, 트레이딩뷰에서 제공하거나 보증하는 것이 아닙니다. 자세한 내용은 이용 약관을 참조하세요.
면책사항
해당 정보와 게시물은 금융, 투자, 트레이딩 또는 기타 유형의 조언이나 권장 사항으로 간주되지 않으며, 트레이딩뷰에서 제공하거나 보증하는 것이 아닙니다. 자세한 내용은 이용 약관을 참조하세요.