PROTECTED SOURCE SCRIPT
업데이트됨 Peak Reversal
This indicator is supposed to help traders identify potential market reversal points. Please note this is not a buy/sell indicator!
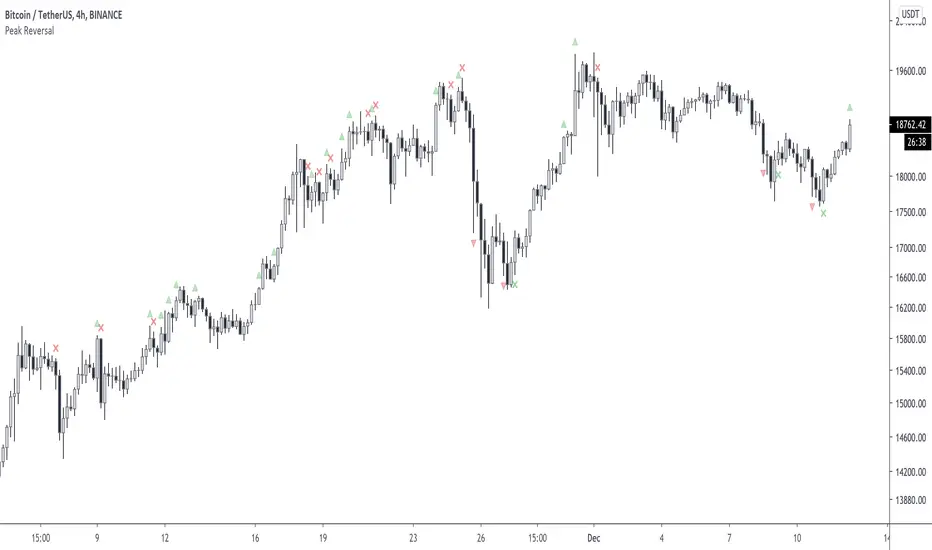
Peak Reversal is an indicator, which can be used as an early identification for a reversal, or a reversion to the mean. In mean reversion we try to find the bar where we can be certain a reversal is in play, as opposed to the proverbial knife catch. Peak Reversal helps by identifying the bar that actually reversed trend. As you can see it is often accurate, but as you can tell, one has to be careful applying this indicator to their trading, as the trend can just continue onwards.
Additionally Peak Reversal uses the same Keltner channels it uses to identify reversals also as breakouts. By default the breakout indication is off, because the chart gets messy otherwise. You can turn it on manually in the settings. When these triangles appear, you can interpret the bars as potentially starting a strong trend. What you don't want to see is a rejection X followed by a breakout triangle obviously.
Note that by default the coloring is very subdued. That's just a personal preference. You can adjust to yours in the settings.
릴리즈 노트
- Biggest new features are alerts. You can set alerts for specific conditions, any group of conditions (reversals or breakouts), and any change no matter what's going on.- Made descriptions more understandable. Instead of calling things "rejections", they are now called reversals with a little triangle to indicate the direction of the reversal. I hope this makes it better for you.
릴리즈 노트
Had a typo.릴리즈 노트
This version adds the ability for the user to set their own preferred Keltner band multiplier in the settings. The default is 1.25.릴리즈 노트
Updating for a better screenshot. No other changes.보호된 스크립트입니다
이 스크립트는 비공개 소스로 게시됩니다. 하지만 이를 자유롭게 제한 없이 사용할 수 있습니다 – 자세한 내용은 여기에서 확인하세요.
면책사항
해당 정보와 게시물은 금융, 투자, 트레이딩 또는 기타 유형의 조언이나 권장 사항으로 간주되지 않으며, 트레이딩뷰에서 제공하거나 보증하는 것이 아닙니다. 자세한 내용은 이용 약관을 참조하세요.
면책사항
해당 정보와 게시물은 금융, 투자, 트레이딩 또는 기타 유형의 조언이나 권장 사항으로 간주되지 않으며, 트레이딩뷰에서 제공하거나 보증하는 것이 아닙니다. 자세한 내용은 이용 약관을 참조하세요.