OPEN-SOURCE SCRIPT
[Hoss] OBV RSI
The OBV ( On Balance Volume ) RSI ( Relative Strength Index ) indicator is an innovative tool that combines the power of OBV and RSI to provide traders with a comprehensive view of the market's momentum and volume dynamics. This combination enables users to make better-informed trading decisions by analyzing the relationship between price, volume , and relative strength .
The script starts by calculating the On Balance Volume , which is a cumulative volume-based indicator that measures buying and selling pressure. The OBV increases when the closing price is higher than the previous closing price and decreases when the closing price is lower than the previous closing price. This helps traders identify potential price trend reversals based on volume accumulation or distribution.
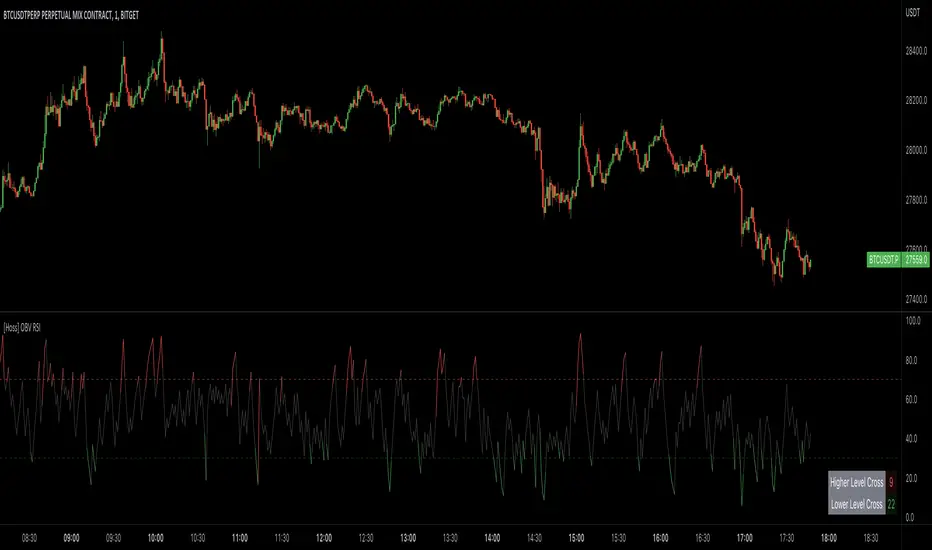
Next, the script computes the Relative Strength Index ( RSI ) based on the OBV values, offering a unique perspective on the market's momentum through the lens of volume . The RSI is a popular momentum indicator that ranges from 0 to 100 and helps traders identify overbought and oversold conditions. In this script, the user can define the RSI length and the higher and lower levels (default values are 70 and 30, respectively).
A distinctive feature of this OBV RSI indicator is the addition of a monitor that counts the number of times the RSI crosses above the higher level and below the lower level within a user-defined lookback period. This monitor is displayed as a table in the bottom right corner of the chart and can be enabled or disabled through an input option.
The cross count monitor provides valuable insights into the historical frequency of RSI crossings, helping traders to identify potential trading opportunities based on historical price behavior around these levels.
The script starts by calculating the On Balance Volume , which is a cumulative volume-based indicator that measures buying and selling pressure. The OBV increases when the closing price is higher than the previous closing price and decreases when the closing price is lower than the previous closing price. This helps traders identify potential price trend reversals based on volume accumulation or distribution.
Next, the script computes the Relative Strength Index ( RSI ) based on the OBV values, offering a unique perspective on the market's momentum through the lens of volume . The RSI is a popular momentum indicator that ranges from 0 to 100 and helps traders identify overbought and oversold conditions. In this script, the user can define the RSI length and the higher and lower levels (default values are 70 and 30, respectively).
A distinctive feature of this OBV RSI indicator is the addition of a monitor that counts the number of times the RSI crosses above the higher level and below the lower level within a user-defined lookback period. This monitor is displayed as a table in the bottom right corner of the chart and can be enabled or disabled through an input option.
The cross count monitor provides valuable insights into the historical frequency of RSI crossings, helping traders to identify potential trading opportunities based on historical price behavior around these levels.
오픈 소스 스크립트
트레이딩뷰의 진정한 정신에 따라, 이 스크립트의 작성자는 이를 오픈소스로 공개하여 트레이더들이 기능을 검토하고 검증할 수 있도록 했습니다. 작성자에게 찬사를 보냅니다! 이 코드는 무료로 사용할 수 있지만, 코드를 재게시하는 경우 하우스 룰이 적용된다는 점을 기억하세요.
macro maximalist
면책사항
해당 정보와 게시물은 금융, 투자, 트레이딩 또는 기타 유형의 조언이나 권장 사항으로 간주되지 않으며, 트레이딩뷰에서 제공하거나 보증하는 것이 아닙니다. 자세한 내용은 이용 약관을 참조하세요.
오픈 소스 스크립트
트레이딩뷰의 진정한 정신에 따라, 이 스크립트의 작성자는 이를 오픈소스로 공개하여 트레이더들이 기능을 검토하고 검증할 수 있도록 했습니다. 작성자에게 찬사를 보냅니다! 이 코드는 무료로 사용할 수 있지만, 코드를 재게시하는 경우 하우스 룰이 적용된다는 점을 기억하세요.
macro maximalist
면책사항
해당 정보와 게시물은 금융, 투자, 트레이딩 또는 기타 유형의 조언이나 권장 사항으로 간주되지 않으며, 트레이딩뷰에서 제공하거나 보증하는 것이 아닙니다. 자세한 내용은 이용 약관을 참조하세요.