PROTECTED SOURCE SCRIPT
FRL RSI-Divs
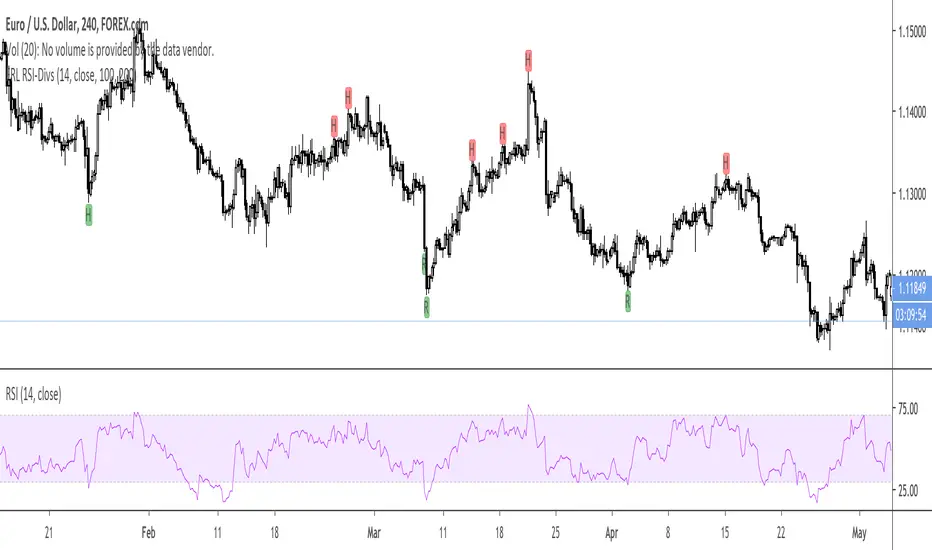
This indicator highlights RSI divergences.
R green label: Regular Bullish Divergence.
H green label: Hidden Bullish Divergence.
R red label: Regular Bearish Divergence.
H red label: Hidden Bearish Divergence.
You can choose the range where the Divergences should be looked for.
Bars Back Min should not be too low to avoid too many false positives.
I found that using a Min of 100 and a Max of 200 was giving decent results.
When a Divergence is found and printed, the value shown in the upper left corner is the number of bars back where the Divergence has been found, so you can check the validity.
보호된 스크립트입니다
이 스크립트는 비공개 소스로 게시됩니다. 하지만 이를 자유롭게 제한 없이 사용할 수 있습니다 – 자세한 내용은 여기에서 확인하세요.
면책사항
해당 정보와 게시물은 금융, 투자, 트레이딩 또는 기타 유형의 조언이나 권장 사항으로 간주되지 않으며, 트레이딩뷰에서 제공하거나 보증하는 것이 아닙니다. 자세한 내용은 이용 약관을 참조하세요.
면책사항
해당 정보와 게시물은 금융, 투자, 트레이딩 또는 기타 유형의 조언이나 권장 사항으로 간주되지 않으며, 트레이딩뷰에서 제공하거나 보증하는 것이 아닙니다. 자세한 내용은 이용 약관을 참조하세요.