OPEN-SOURCE SCRIPT
업데이트됨 Multi-Timeframe Highs and Lows
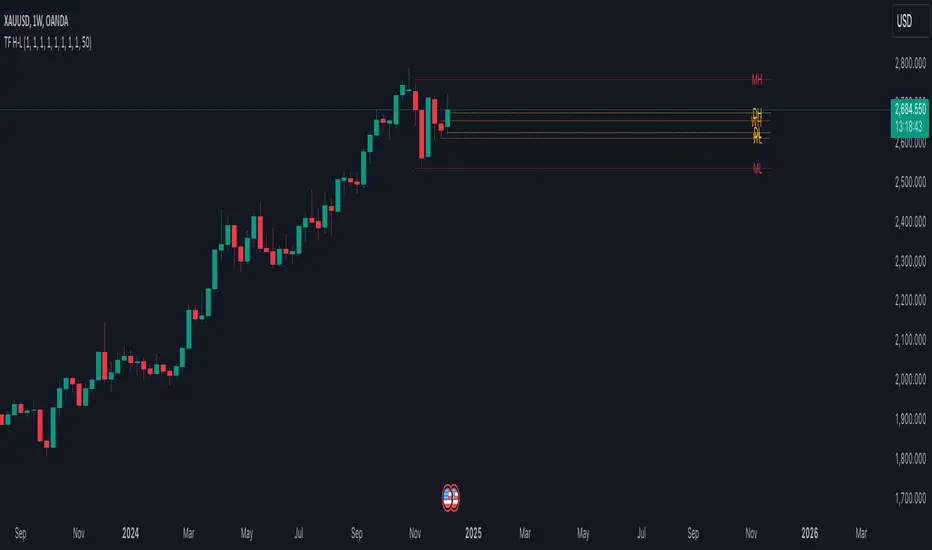
The "Multi-Timeframe Highs and Lows" indicator is a comprehensive tool designed to plot recent Highs and Lows across multiple timeframes, including 15-Minute, 30-Minute, 1-Hour, 4-Hour, 8-Hour, Daily, Weekly, and Monthly. This indicator provides traders with a clear view of critical support and resistance levels, enabling precise decision-making for entries, exits, and stop-loss placements. It features customizable lookbacks, dynamic line extensions, and advanced label placement logic to prevent overlap, ensuring a clean and clutter-free chart. With fully customizable colors and styles for each timeframe, traders can tailor the indicator to their preferences. Whether you’re a scalper, swing trader, or position trader, this tool adapts to your strategy, providing actionable insights for breakout, reversal, and trend-following setups. Optimized for performance, it handles multiple lines and labels efficiently, making it suitable for high-activity charts. The "Multi-Timeframe Highs and Lows" indicator is an indispensable tool for traders seeking to identify and utilize key price levels across all timeframes with precision and clarity.
릴리즈 노트
OverviewThe Multi-Timeframe Highs & Lows (MTF H-L) indicator is a versatile tool designed for traders who seek to monitor and analyze significant price levels across multiple timeframes. By plotting the highs and lows of selected timeframes directly on your chart, this indicator provides a comprehensive view of key support and resistance levels, enhancing your technical analysis and trading strategies.
Key Features
Multi-Timeframe Analysis: Monitor highs and lows across various timeframes including 15 minutes, 30 minutes, 1 hour, 4 hours, 8 hours, Daily, Weekly, and Monthly.
릴리즈 노트
OverviewThe TF Highs & Lows (TF H-L) indicator is a versatile tool designed for traders who seek to monitor and analyze significant price levels across multiple timeframes. By plotting the highs and lows of selected timeframes directly on your chart, this indicator provides a comprehensive view of key support and resistance levels, enhancing your technical analysis and trading strategies.
Key Features
- Multi-Timeframe Analysis: Monitor highs and lows across various timeframes including 15 minutes, 30 minutes, 1 hour, 4 hours, 8 hours, Daily, Weekly, and Monthly.
- Customizable Lookback Period: Analyze historical highs and lows by setting a lookback period (from 1 to 100 candles) for each timeframe, allowing you to review significant levels over your desired number of past candles.
- Flexible Timeframe Selection: Enable or disable any of the available timeframes based on your trading needs, ensuring a clutter-free and focused chart view.
- Visual Customization: Customize the color of high and low lines for each timeframe, adjust the right extension of lines (in bars), and manage label placements to suit your visual preferences.
- Efficient Label Management: Automatically handles label placement to prevent overlaps, ensuring clear and readable annotations on your chart.
- Invisible Data Plots: Includes hidden plots for the data window, enabling seamless integration with other indicators and ensuring that your chart remains clean and uncluttered.
Inputs and Customizations: Indicator Settings
Timeframe Selection
- 15M: Enable/disable monitoring of 15-minute timeframe.
- 30M: Enable/disable monitoring of 30-minute timeframe.
- 1H: Enable/disable monitoring of 1-hour timeframe.
- 4H: Enable/disable monitoring of 4-hour timeframe.
- 8H: Enable/disable monitoring of 8-hour timeframe.
- Daily: Enable/disable monitoring of Daily timeframe.
- Weekly: Enable/disable monitoring of Weekly timeframe.
- Monthly: Enable/disable monitoring of Monthly timeframe.
Lookback Periods:
- 15M Lookback: Set the number of past 15-minute candles to analyze.
- 30M Lookback: Set the number of past 30-minute candles to analyze.
- 1H Lookback: Set the number of past 1-hour candles to analyze.
- 4H Lookback: Set the number of past 4-hour candles to analyze.
- 8H Lookback: Set the number of past 8-hour candles to analyze.
- Daily Lookback: Set the number of past Daily candles to analyze.
- Weekly Lookback: Set the number of past Weekly candles to analyze.
- Monthly Lookback: Set the number of past Monthly candles to analyze.
Style Settings:
- Right Extension (bars): Define how far to extend the high and low lines to the right of the chart (minimum 1 bar).
- Line Colors: Customize the colors for each timeframe’s high and low lines to enhance visual differentiation.
오픈 소스 스크립트
트레이딩뷰의 진정한 정신에 따라, 이 스크립트의 작성자는 이를 오픈소스로 공개하여 트레이더들이 기능을 검토하고 검증할 수 있도록 했습니다. 작성자에게 찬사를 보냅니다! 이 코드는 무료로 사용할 수 있지만, 코드를 재게시하는 경우 하우스 룰이 적용된다는 점을 기억하세요.
면책사항
해당 정보와 게시물은 금융, 투자, 트레이딩 또는 기타 유형의 조언이나 권장 사항으로 간주되지 않으며, 트레이딩뷰에서 제공하거나 보증하는 것이 아닙니다. 자세한 내용은 이용 약관을 참조하세요.
오픈 소스 스크립트
트레이딩뷰의 진정한 정신에 따라, 이 스크립트의 작성자는 이를 오픈소스로 공개하여 트레이더들이 기능을 검토하고 검증할 수 있도록 했습니다. 작성자에게 찬사를 보냅니다! 이 코드는 무료로 사용할 수 있지만, 코드를 재게시하는 경우 하우스 룰이 적용된다는 점을 기억하세요.
면책사항
해당 정보와 게시물은 금융, 투자, 트레이딩 또는 기타 유형의 조언이나 권장 사항으로 간주되지 않으며, 트레이딩뷰에서 제공하거나 보증하는 것이 아닙니다. 자세한 내용은 이용 약관을 참조하세요.