OPEN-SOURCE SCRIPT
업데이트됨 Highest Price Marker
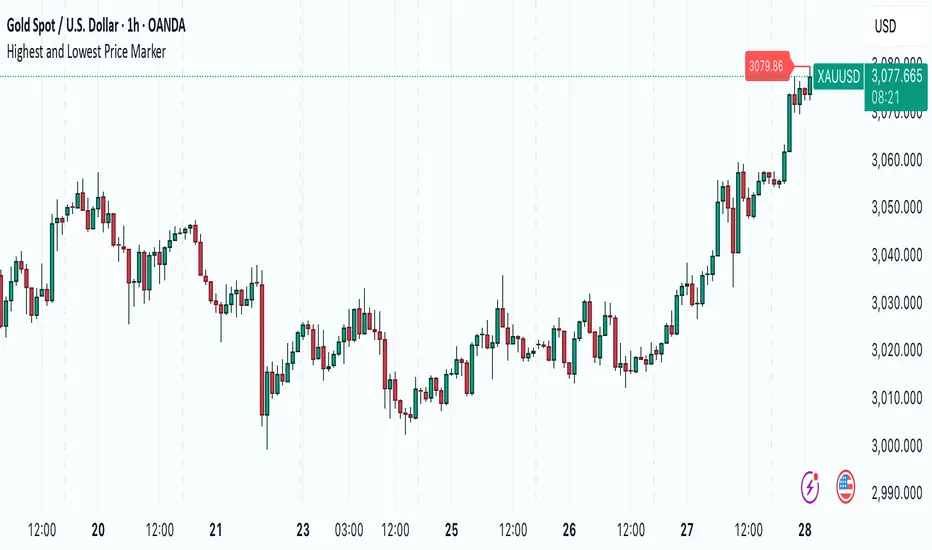
Highest Price Marker – Smart Label & Line Indicator
This Pine Script v5 indicator highlights the highest price reached within the last 100 bars on your chart. It visually enhances key price levels by:
✅ Placing a label at the highest price, positioned 3 candles to the left for clarity.
✅ Drawing a line connecting the label to the actual high for better visibility.
✅ Auto-updating dynamically whenever a new highest price is detected.
This is useful for traders who want to quickly identify resistance levels or analyze historical price peaks without cluttering the chart.
🔹 How to Use:
Add the indicator to your chart.
Look for the red label marking the highest price within the last 100 bars.
The horizontal line helps track the exact price level.
💡 Customization Ideas:
Adjust the lookback period (length = 100) to detect longer or shorter trends.
Modify colors or label positioning to suit your preferences.
🚀 Perfect for:
🔸 Price Action Traders
🔸 Swing & Breakout Traders
🔸 Support & Resistance Analysis
릴리즈 노트
This indicator scans the past 100 bars to pinpoint the most extreme price levels, marking the highest and lowest values on your chart. It adds dynamic labels and connecting lines that visually capture these key price points, providing you with a clear reference of where significant price movements have occurred over your chosen period.By displaying these price markers in real time, the tool gives you an intuitive snapshot of market extremes, enabling you to better monitor sudden shifts and evaluate market sentiment. Whether you're tracking intraday volatility or analyzing longer-term trends, this indicator serves as a practical guide to the price action that matters most.
오픈 소스 스크립트
트레이딩뷰의 진정한 정신에 따라, 이 스크립트의 작성자는 이를 오픈소스로 공개하여 트레이더들이 기능을 검토하고 검증할 수 있도록 했습니다. 작성자에게 찬사를 보냅니다! 이 코드는 무료로 사용할 수 있지만, 코드를 재게시하는 경우 하우스 룰이 적용된다는 점을 기억하세요.
면책사항
해당 정보와 게시물은 금융, 투자, 트레이딩 또는 기타 유형의 조언이나 권장 사항으로 간주되지 않으며, 트레이딩뷰에서 제공하거나 보증하는 것이 아닙니다. 자세한 내용은 이용 약관을 참조하세요.
오픈 소스 스크립트
트레이딩뷰의 진정한 정신에 따라, 이 스크립트의 작성자는 이를 오픈소스로 공개하여 트레이더들이 기능을 검토하고 검증할 수 있도록 했습니다. 작성자에게 찬사를 보냅니다! 이 코드는 무료로 사용할 수 있지만, 코드를 재게시하는 경우 하우스 룰이 적용된다는 점을 기억하세요.
면책사항
해당 정보와 게시물은 금융, 투자, 트레이딩 또는 기타 유형의 조언이나 권장 사항으로 간주되지 않으며, 트레이딩뷰에서 제공하거나 보증하는 것이 아닙니다. 자세한 내용은 이용 약관을 참조하세요.