OPEN-SOURCE SCRIPT
업데이트됨 NYSE UVOL Ratio

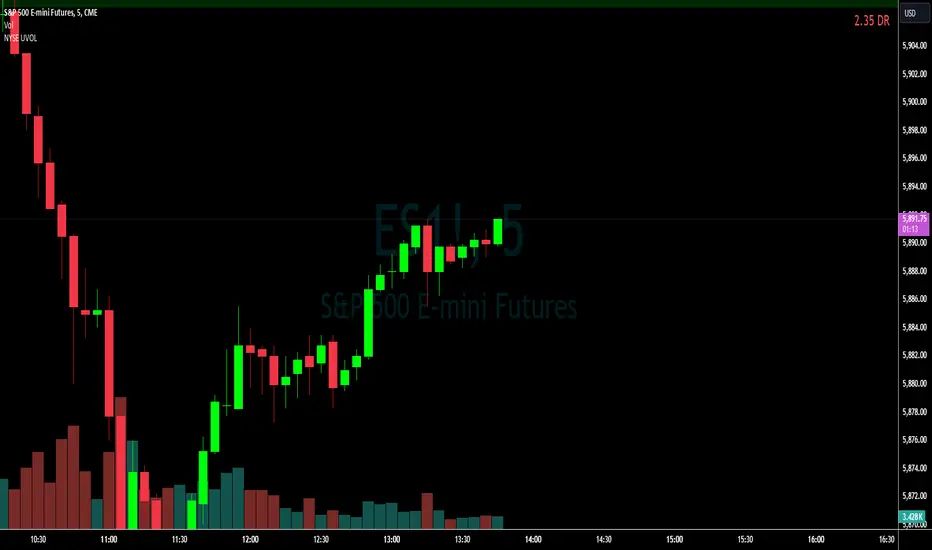
This Pine Script is designed to monitor and display the ratio of advancing volume (UVOL) to declining volume (DVOL) on the NYSE in real-time on your TradingView charts. Here's a breakdown of what each part of the script does:
Indicator Declaration: The script starts by declaring an indicator called "NYSE UVOL" with the option to overlay it directly on the price chart. This allows you to see the volume ratio in context with price movements.
Volume Data Fetching:
Advancing Volume (UVOL): It retrieves the closing value of the advancing volume from the NYSE.
Declining Volume (DVOL): It fetches the closing value of the declining volume.
Ratio Calculation:
The script calculates the ratio of advancing to declining volume. To avoid division by zero, it checks if the declining volume is not zero before performing the division.
Color Coding:
The script assigns a color to the ratio value based on set thresholds:
Red for a ratio less than 1 (more declining than advancing volume).
White for ratios between 1 and 2.
Lime for ratios between 2 and 3.
Green for ratios above 3.
Display Table:
A table is created in the top-right corner of the chart to display the current ratio value.
It updates this table with the latest ratio value at each new bar, displaying the ratio with appropriate color coding for quick reference.
This script provides a visual and numerical representation of market sentiment based on volume data, aiding traders in assessing the balance between buying and selling pressure.
릴리즈 노트
Modified to avoid fractions when DVOL greater than UVOL.New values are displayed in red when DVOL exceeds UVOL and green when UVOL exceeds DVOL.
오픈 소스 스크립트
트레이딩뷰의 진정한 정신에 따라, 이 스크립트의 작성자는 이를 오픈소스로 공개하여 트레이더들이 기능을 검토하고 검증할 수 있도록 했습니다. 작성자에게 찬사를 보냅니다! 이 코드는 무료로 사용할 수 있지만, 코드를 재게시하는 경우 하우스 룰이 적용된다는 점을 기억하세요.
면책사항
해당 정보와 게시물은 금융, 투자, 트레이딩 또는 기타 유형의 조언이나 권장 사항으로 간주되지 않으며, 트레이딩뷰에서 제공하거나 보증하는 것이 아닙니다. 자세한 내용은 이용 약관을 참조하세요.
오픈 소스 스크립트
트레이딩뷰의 진정한 정신에 따라, 이 스크립트의 작성자는 이를 오픈소스로 공개하여 트레이더들이 기능을 검토하고 검증할 수 있도록 했습니다. 작성자에게 찬사를 보냅니다! 이 코드는 무료로 사용할 수 있지만, 코드를 재게시하는 경우 하우스 룰이 적용된다는 점을 기억하세요.
면책사항
해당 정보와 게시물은 금융, 투자, 트레이딩 또는 기타 유형의 조언이나 권장 사항으로 간주되지 않으며, 트레이딩뷰에서 제공하거나 보증하는 것이 아닙니다. 자세한 내용은 이용 약관을 참조하세요.