OPEN-SOURCE SCRIPT
업데이트됨 Binance Open Interest (+SMA)
# Binance Open Interest + SMA
An indicator showing open interest (OI) in US dollars ($) for Binance USD-margined perpetual contracts. This means the indicator shows the total value of all open perpetual contracts on the Binance platform for the ticker being charted. As such, it can provide insights into market activity for an asset and trading interest, as rising open interest suggests many traders are opening new positions and new money is flowing into the market, and vice-versa. It is also an indicator of the liquidity of the asset's perpetuals contracts, as it reflects the amount of money in a given perpetuals market.
The candle data is shown as expected, with green candles indicating the IU at close is greater than at open, red indicating a lower OI at close than open, with the bodies indicating the open and close prices, and any wicks representing an OI value within that timeframe that went above or below the closing or opening OI.
Unlike other Binance open interest indicators on the platform, this one does not require user input and will automatically pull open interest data for the ticker being looked at, allowing for quicker access to open interest data. It also presents the open interest data in candle format, providing more detail into the open interest at a given timeframe.
Please note that this indicator will only work for assets which Binance offers USD-margined perpetual contracts for, and otherwise will not work.
## Instructions:
Simply add the indicator to your chart and open the asset you would like to chart. If a Binance perpetual contract exists for the asset, the open interest value will be charted. If no chart is generated, no Binance open interest data is available for charting.
To remove the SMA, uncheck the “SMA” box in the style section in the indicator settings. You can also change the source and length of time the SMA data is calculated from in the inputs section. By default, it is based off of the closing value and a length of 15 timeframes.
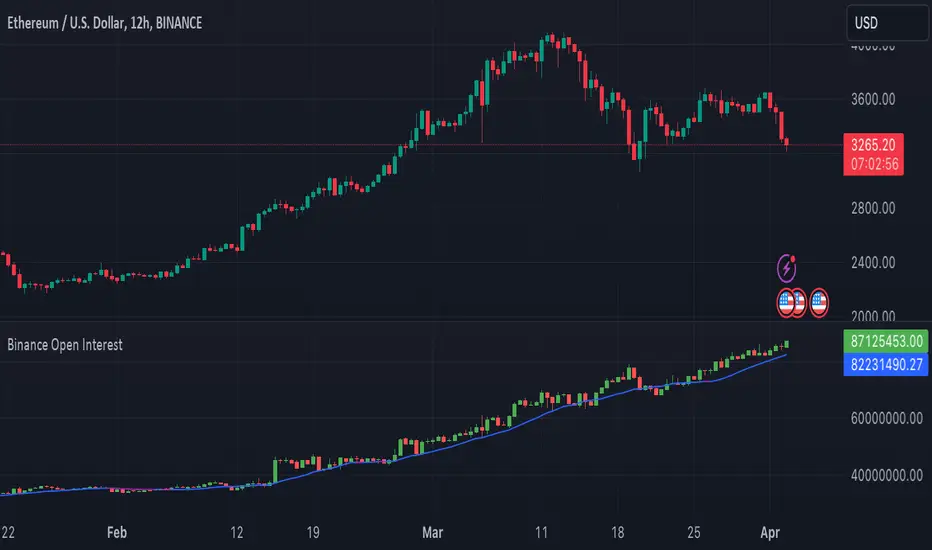
## Chart example:
The chart shows the price of Ethereum, and below it this indicator for open interest on Binance for their Ethereum perpetual contracts. We can see here open interest is rising steadily, indicating rising interest in holding perpetual contracts backed by Ethereum.
An indicator showing open interest (OI) in US dollars ($) for Binance USD-margined perpetual contracts. This means the indicator shows the total value of all open perpetual contracts on the Binance platform for the ticker being charted. As such, it can provide insights into market activity for an asset and trading interest, as rising open interest suggests many traders are opening new positions and new money is flowing into the market, and vice-versa. It is also an indicator of the liquidity of the asset's perpetuals contracts, as it reflects the amount of money in a given perpetuals market.
The candle data is shown as expected, with green candles indicating the IU at close is greater than at open, red indicating a lower OI at close than open, with the bodies indicating the open and close prices, and any wicks representing an OI value within that timeframe that went above or below the closing or opening OI.
Unlike other Binance open interest indicators on the platform, this one does not require user input and will automatically pull open interest data for the ticker being looked at, allowing for quicker access to open interest data. It also presents the open interest data in candle format, providing more detail into the open interest at a given timeframe.
Please note that this indicator will only work for assets which Binance offers USD-margined perpetual contracts for, and otherwise will not work.
## Instructions:
Simply add the indicator to your chart and open the asset you would like to chart. If a Binance perpetual contract exists for the asset, the open interest value will be charted. If no chart is generated, no Binance open interest data is available for charting.
To remove the SMA, uncheck the “SMA” box in the style section in the indicator settings. You can also change the source and length of time the SMA data is calculated from in the inputs section. By default, it is based off of the closing value and a length of 15 timeframes.
## Chart example:
The chart shows the price of Ethereum, and below it this indicator for open interest on Binance for their Ethereum perpetual contracts. We can see here open interest is rising steadily, indicating rising interest in holding perpetual contracts backed by Ethereum.
릴리즈 노트
# Binance Open Interest + SMA An indicator showing open interest (OI) in US dollars ($) for Binance USD-margined perpetual contracts. This means the indicator shows the total value of all open perpetual contracts on the Binance platform for the ticker being charted. As such, it can provide insights into market activity for an asset and trading interest, as rising open interest suggests many traders are opening new positions and new money is flowing into the market, and vice-versa. It is also an indicator of the liquidity of the asset's perpetuals contracts, as it reflects the amount of money in a given perpetuals market.
The candle data is shown as expected, with green candles indicating the IU at close is greater than at open, red indicating a lower OI at close than open, with the bodies indicating the open and close prices, and any wicks representing an OI value within that timeframe that went above or below the closing or opening OI.
Unlike other Binance open interest indicators on the platform, this one does not require user input and will automatically pull open interest data for the ticker being looked at, allowing for quicker access to open interest data. It also presents the open interest data in candle format, providing more detail into the open interest at a given timeframe.
Please note that this indicator will only work for assets which Binance offers USD-margined perpetual contracts for, and otherwise will not work.
## Instructions:
Simply add the indicator to your chart and open the asset you would like to chart. If a Binance perpetual contract exists for the asset, the open interest value will be charted. If no chart is generated, no Binance open interest data is available for charting.
To remove the SMA, uncheck the “SMA” box in the style section in the indicator settings. You can also change the source and length of time the SMA data is calculated from in the inputs section. By default, it is based off of the closing value and a length of 15 timeframes.
The indicator supports both USD and USDT markets.
## Chart example:
The chart shows the price of Ethereum, and below it this indicator for open interest on Binance for their Ethereum perpetual contracts. We can see here open interest is rising steadily, indicating rising interest in holding perpetual contracts backed by Ethereum.
오픈 소스 스크립트
트레이딩뷰의 진정한 정신에 따라, 이 스크립트의 작성자는 이를 오픈소스로 공개하여 트레이더들이 기능을 검토하고 검증할 수 있도록 했습니다. 작성자에게 찬사를 보냅니다! 이 코드는 무료로 사용할 수 있지만, 코드를 재게시하는 경우 하우스 룰이 적용된다는 점을 기억하세요.
면책사항
해당 정보와 게시물은 금융, 투자, 트레이딩 또는 기타 유형의 조언이나 권장 사항으로 간주되지 않으며, 트레이딩뷰에서 제공하거나 보증하는 것이 아닙니다. 자세한 내용은 이용 약관을 참조하세요.
오픈 소스 스크립트
트레이딩뷰의 진정한 정신에 따라, 이 스크립트의 작성자는 이를 오픈소스로 공개하여 트레이더들이 기능을 검토하고 검증할 수 있도록 했습니다. 작성자에게 찬사를 보냅니다! 이 코드는 무료로 사용할 수 있지만, 코드를 재게시하는 경우 하우스 룰이 적용된다는 점을 기억하세요.
면책사항
해당 정보와 게시물은 금융, 투자, 트레이딩 또는 기타 유형의 조언이나 권장 사항으로 간주되지 않으며, 트레이딩뷰에서 제공하거나 보증하는 것이 아닙니다. 자세한 내용은 이용 약관을 참조하세요.