OPEN-SOURCE SCRIPT
EMA-BAND-PIVOT-VCP
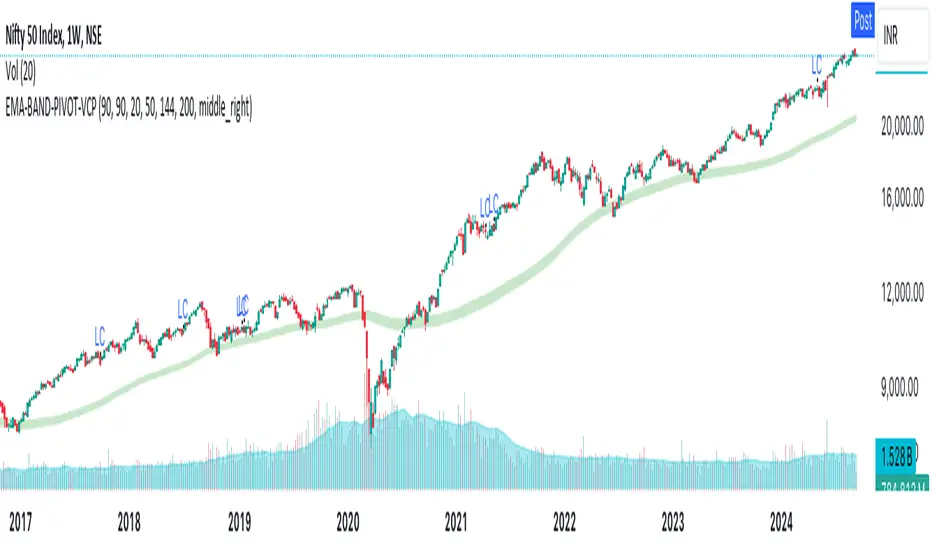
This indicator is named "EMA-BAND-PIVOT-VCP" and integrates multiple elements such as moving averages, volume, volatility contraction patterns (VCP), pivot points, and a table to display key market metrics.
Key Features:
Moving Averages: ( 4 - EMA) default settings 20 , 50 ,144 , 200 . Can be changed in settings.
Pivot Highs and Lows:
The script detects pivot highs and pivot lows using customizable left and right lengths and plots labels to mark these points on the chart.
TIG BAND : This is setting of 2 sma - with the high and low of 90 day average which forms like a band . Its a very strong indicator of trend . Buying is suggestable above this .This has to be tested on your own to knowhow it works wonders ( price magnet). Works on all timeframes . (credit : Bhushan Sir from TIG ) .These are the best buy areas.
Volatility Contraction :
It identifies specific price contraction pattern .
vc marked - used 4 candles - first candle is the mother bar ., 2,3 and 4th candles complete range ( high to low ) is within the range of mother candle.
lc marked -here the closing is considered not the wicks. used 8 candles., the 7 candles closing is within the range of motherbar. Crosses are plotted on the last candle
Table Display:
A table is displayed on the chart with data such as EMA values, relative volume (RVol), Average Daily Range (ADR), and volume ratios. This gives a comprehensive overview of current market conditions.(RVol) compared to the 50-period volume SMA, percentage volume change, and other metrics is also displayed.
오픈 소스 스크립트
트레이딩뷰의 진정한 정신에 따라, 이 스크립트의 작성자는 이를 오픈소스로 공개하여 트레이더들이 기능을 검토하고 검증할 수 있도록 했습니다. 작성자에게 찬사를 보냅니다! 이 코드는 무료로 사용할 수 있지만, 코드를 재게시하는 경우 하우스 룰이 적용된다는 점을 기억하세요.
면책사항
해당 정보와 게시물은 금융, 투자, 트레이딩 또는 기타 유형의 조언이나 권장 사항으로 간주되지 않으며, 트레이딩뷰에서 제공하거나 보증하는 것이 아닙니다. 자세한 내용은 이용 약관을 참조하세요.
오픈 소스 스크립트
트레이딩뷰의 진정한 정신에 따라, 이 스크립트의 작성자는 이를 오픈소스로 공개하여 트레이더들이 기능을 검토하고 검증할 수 있도록 했습니다. 작성자에게 찬사를 보냅니다! 이 코드는 무료로 사용할 수 있지만, 코드를 재게시하는 경우 하우스 룰이 적용된다는 점을 기억하세요.
면책사항
해당 정보와 게시물은 금융, 투자, 트레이딩 또는 기타 유형의 조언이나 권장 사항으로 간주되지 않으며, 트레이딩뷰에서 제공하거나 보증하는 것이 아닙니다. 자세한 내용은 이용 약관을 참조하세요.