OPEN-SOURCE SCRIPT
Daily ATR Bands
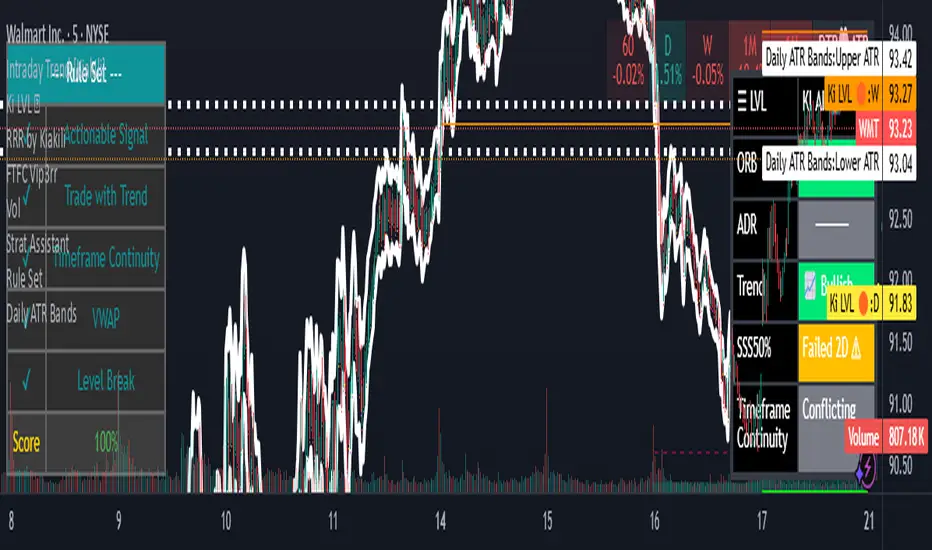
ATR Finder – Volatility Scanner for Smarter Trade Setups
The ATR Finder is a precision tool designed to help traders quickly identify high-volatility assets using the Average True Range (ATR) – a key metric in assessing market momentum and potential breakout zones. By automatically scanning and highlighting tickers or candles with elevated ATR values relative to their recent historical range, this indicator helps you filter for setups that are more likely to experience significant price moves.
Whether you're a day trader seeking intraday momentum or a swing trader looking for setups with strong follow-through potential, the ATR Finder cuts through the noise and visually signals which assets are "on the move." It can be paired with other indicators or price action tools to create a high-conviction trading strategy focused on volatility expansion.
Key Features:
Dynamic ATR Calculation over a user-defined period
Visual Alerts or Color-Coding for above-threshold volatility spikes
Supports Multiple Timeframes for both short- and long-term volatility analysis
Great for spotting breakout opportunities, gap continuations, or trend reversals
Use the ATR Finder to stay ahead of price action and build a watchlist that moves with purpose. Perfect for scalpers, breakout traders, and anyone who respects the power of volatility.
오픈 소스 스크립트
트레이딩뷰의 진정한 정신에 따라, 이 스크립트의 작성자는 이를 오픈소스로 공개하여 트레이더들이 기능을 검토하고 검증할 수 있도록 했습니다. 작성자에게 찬사를 보냅니다! 이 코드는 무료로 사용할 수 있지만, 코드를 재게시하는 경우 하우스 룰이 적용된다는 점을 기억하세요.
면책사항
해당 정보와 게시물은 금융, 투자, 트레이딩 또는 기타 유형의 조언이나 권장 사항으로 간주되지 않으며, 트레이딩뷰에서 제공하거나 보증하는 것이 아닙니다. 자세한 내용은 이용 약관을 참조하세요.
오픈 소스 스크립트
트레이딩뷰의 진정한 정신에 따라, 이 스크립트의 작성자는 이를 오픈소스로 공개하여 트레이더들이 기능을 검토하고 검증할 수 있도록 했습니다. 작성자에게 찬사를 보냅니다! 이 코드는 무료로 사용할 수 있지만, 코드를 재게시하는 경우 하우스 룰이 적용된다는 점을 기억하세요.
면책사항
해당 정보와 게시물은 금융, 투자, 트레이딩 또는 기타 유형의 조언이나 권장 사항으로 간주되지 않으며, 트레이딩뷰에서 제공하거나 보증하는 것이 아닙니다. 자세한 내용은 이용 약관을 참조하세요.