PROTECTED SOURCE SCRIPT
Volume Trend

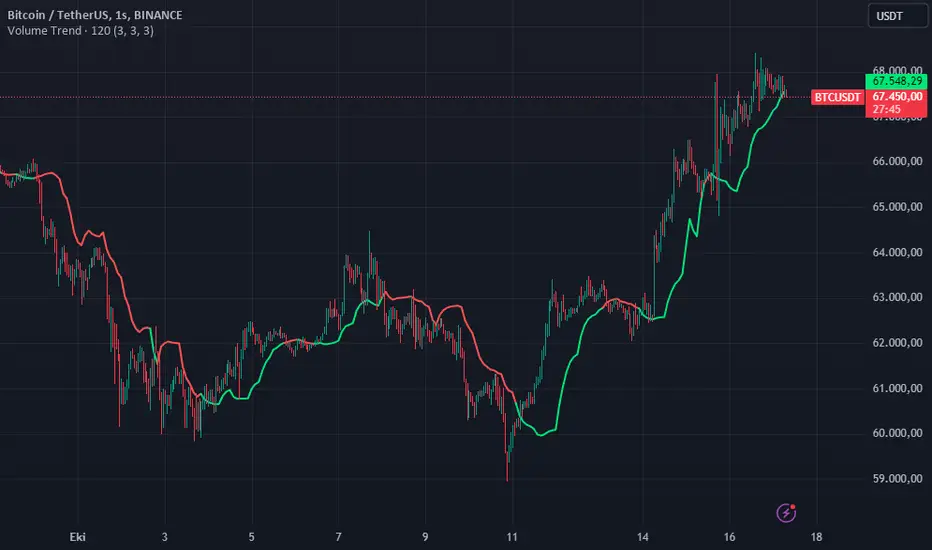
This code defines a custom indicator called "Volume Trend" that aims to identify trends in price action based on volume changes. The indicator calculates a smoothed average of volume data and correlates it with price movements to determine potential support and resistance levels, which are then plotted on the chart. This helps traders make informed decisions about buying and selling based on volume trends.
Key Components and Functionalities:
Inputs:
len (Length): Defines the period for the Exponential Moving Average (EMA) calculation of the volume. This helps to smooth the volume data.
lb (Look Back): Determines how far back the indicator looks to calculate the highest and lowest price points in relation to volume changes.
smt (Smooth): Determines the smoothing level applied to the average of the highest and lowest points to create a smoother trend line.
Volume Analysis:
The script calculates an EMA of the volume using the specified length (len). This smoothed volume data is used to detect volume-based price movements.
Two variables, vl1 and vl2, are used to store the highest and lowest price points based on whether the current volume is higher or lower than the previous volume.
Price-Level Calculation:
The script computes an average of the highest and lowest price levels (vl1 and vl2), and then applies another EMA smoothing to create the final trend line (vl).
Color-Coding of the Trend Line:
Green (lime): When the trend line (vl) is below the current price, indicating a potential uptrend.
Red (red): When the trend line is above the current price, indicating a potential downtrend.
Yellow (yellow): When the trend line is at the same level as the current price, indicating a potential consolidation or neutral trend.
Plotting:
The smoothed trend line (vl) is plotted on the chart with color changes based on its relation to the current price (green for uptrend, red for downtrend, yellow for neutral).
Usage:
The Volume Trend indicator is designed to help traders analyze the relationship between volume and price trends. By plotting dynamic support and resistance levels based on volume changes, it allows traders to:
Identify potential uptrends or downtrends in price based on volume movements.
Spot possible consolidation areas where the price is neutral.
Make better decisions on when to enter or exit trades based on volume-driven price levels.
This indicator can be useful for both short-term and long-term traders who want to incorporate volume analysis into their trading strategies.
Advice:
If you choose the time setting 2 or 3 times higher than the graphics resolution, clearer visuals may appear.
Important Note:
This script is provided for educational purposes and does not constitute financial advice. Traders and investors should conduct their research and analysis before making any trading decisions.
보호된 스크립트입니다
이 스크립트는 비공개 소스로 게시됩니다. 하지만 이를 자유롭게 제한 없이 사용할 수 있습니다 – 자세한 내용은 여기에서 확인하세요.
면책사항
해당 정보와 게시물은 금융, 투자, 트레이딩 또는 기타 유형의 조언이나 권장 사항으로 간주되지 않으며, 트레이딩뷰에서 제공하거나 보증하는 것이 아닙니다. 자세한 내용은 이용 약관을 참조하세요.
보호된 스크립트입니다
이 스크립트는 비공개 소스로 게시됩니다. 하지만 이를 자유롭게 제한 없이 사용할 수 있습니다 – 자세한 내용은 여기에서 확인하세요.
면책사항
해당 정보와 게시물은 금융, 투자, 트레이딩 또는 기타 유형의 조언이나 권장 사항으로 간주되지 않으며, 트레이딩뷰에서 제공하거나 보증하는 것이 아닙니다. 자세한 내용은 이용 약관을 참조하세요.