OPEN-SOURCE SCRIPT
업데이트됨 Price Stats / Price Data [LevelUp]
Introduction
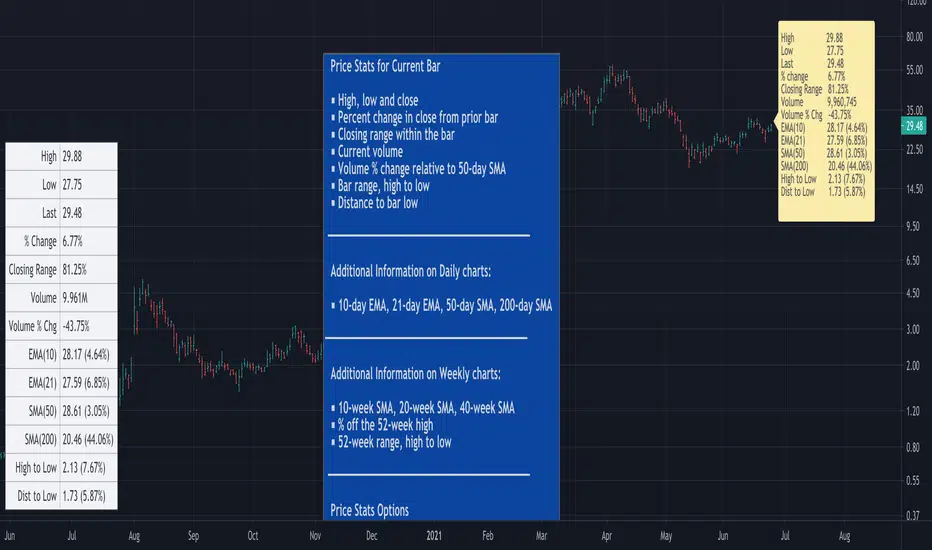
Price Stats is an indicator based on the statistics shown in MarketSmith charting software when viewing the Track Price information, also known as the "yellow box."
The following stats are available for the most recent price bar:
■ High price
■ Low price
■ Last price
■ Percent change in price from prior bar
■ Closing range within the bar
■ Current volume
■ Volume % change relative to the 50-day moving average volume
For daily charts:
■ 21-day EMA and % offset of price
■ 50-day SMA and % offset of price
■ 200-day SMA and % offset of price
Here's how to interpret the moving averages:
In the image below the 50-day SMA is 74.58 (8.04%). 74.58 represents the value of the 50-day SMA. 8.04% indicates that the current price is 8.04% above the SMA. A negative % would indicate the current price is the specified % below the SMA.
릴리즈 노트
version 2.0Add support to show price stats for weekly charts:
■ 10-week SMA and % offset of price
■ 40-week SMA and % offset of price
■ Price % off the 52-week high
■ 52-week price range, high to low
릴리즈 노트
version 3.0Updates:
■ Left/right offset of the Price Stats dialog can now be configured.
■ Minor changes to how the offset is calculated based on the day of the week.
릴리즈 노트
version 4.0Update:
■ Choose your preferred font size for the text.
릴리즈 노트
version 5.0Update:
■ Update formatting of the volume to make it easier to read.
릴리즈 노트
version 6.0Update:
■ Add "Distance to Low" option
Knowing the distance to the low can help when setting a stop. For example, if buying an upside reversal, a logical stop could be set at the low of the bar. At a glance, you can now see the percentage and distance in points from the current price to the low. This allows for a quick determination if low is within your preferred stop range.
릴리즈 노트
version 7.0Update:
■ Duplicate labels no longer appear when using the Bar Replay option
■ Code cleanup
릴리즈 노트
version 8.0Updates:
■ Vertical and horizontal placement of the Price Stats are now configurable.
■ Add 'High to Low' which shows range in price as points and percentage.
The 'High to Low' value may be helpful if you plan to buy on a breakout to a new high. At a glance, you'll know the percentage and distance in points if you opt to use the low of the bar as a stop.
릴리즈 노트
version 9.0What's new:
■ Add 20-week simple moving average to the weekly chart.
릴리즈 노트
version 10.0What's New:
■ Price Stats can be shown in a table with a configurable location.
릴리즈 노트
version 11.0What's New:
■ Computations that return NaN (Not a Number) will now return 0.
릴리즈 노트
version 12.0What's New:
■ Minor updates to the display of 52-week highs and lows.
오픈 소스 스크립트
트레이딩뷰의 진정한 정신에 따라, 이 스크립트의 작성자는 이를 오픈소스로 공개하여 트레이더들이 기능을 검토하고 검증할 수 있도록 했습니다. 작성자에게 찬사를 보냅니다! 이 코드는 무료로 사용할 수 있지만, 코드를 재게시하는 경우 하우스 룰이 적용된다는 점을 기억하세요.
Join traders in over 40 countries and LevelUp!
tradingview.com/spaces/LevelUpTools/
tradingview.com/spaces/LevelUpTools/
면책사항
해당 정보와 게시물은 금융, 투자, 트레이딩 또는 기타 유형의 조언이나 권장 사항으로 간주되지 않으며, 트레이딩뷰에서 제공하거나 보증하는 것이 아닙니다. 자세한 내용은 이용 약관을 참조하세요.