OPEN-SOURCE SCRIPT
Bull Bear Power with Optional Normalization Function
This indicator is designed to provide traders with insights into market sentiment and potential trend reversals. This indicator enhances the traditional Bull Bear Power (BBP) by adding valuable visualizations and customization options to assist traders in making informed trading decisions.
Indicator Overview:
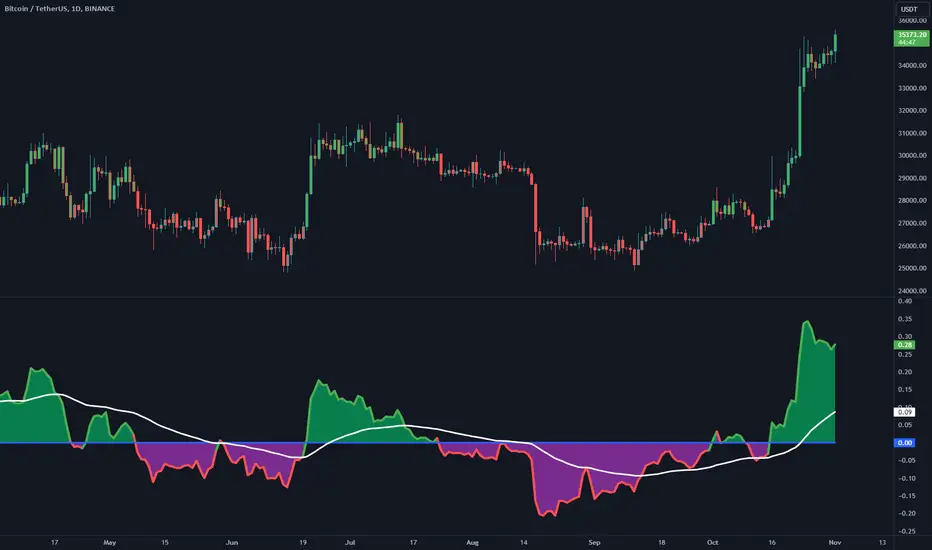
The NBBP indicator calculates Bull Bear Power, which measures the strength of bullish and bearish forces in the market. It does so by taking the difference between the high and the exponential moving average (EMA) of the closing price for a specified length. This raw BBP is represented on the chart as a line.
Key Features:
-- Zero Line: The NBBP indicator introduces a central reference line at zero. This line serves as a pivotal point for interpreting market sentiment. When the BBP line is above zero, it is colored green, indicating a predominance of bullish sentiment. Conversely, when the BBP line is below zero, it turns red, signaling a prevalence of bearish sentiment. This coloration helps traders quickly identify shifts in market sentiment.
-- OPTIONAL Normalization Function: One of the standout features of the NBBP indicator is its optional normalization function. When activated in the settings menu, this function scales the BBP values from -1 to +1. This means that BBP values are adjusted to fit within a standardized range, making it easier for traders to compare sentiment across different timeframes or assets. Normalization is particularly valuable for identifying extreme sentiment conditions and potential reversals.
-- Moving Average: To provide additional context and smooth out BBP fluctuations, the indicator includes an exponential moving average (EMA). The EMA of BBP is plotted on the chart as a white line. Traders can use this moving average to identify trends and potential trend reversals.
-- Fill Between Lines: The indicator visually enhances the BBP by filling the area between the BBP line and the zero line with a translucent color. This fill helps traders visualize the strength and duration of bullish or bearish sentiment.
Interpretation:
-- BBP Line: Traders can assess the raw BBP line for shifts in sentiment. When the line crosses above zero, it may suggest a shift from bearish to bullish sentiment, potentially indicating a buying opportunity. Conversely, when the line crosses below zero, it may signal a shift from bullish to bearish sentiment, suggesting a potential selling opportunity.
-- Normalization Function: The optional normalization function allows traders to gauge sentiment on a standardized scale. Values above 0 indicate bullish sentiment, while values below 0 suggest bearish sentiment. The closer the values are to their polar ends (-1 or +1), the stronger the sentiment.
-- Moving Average: The EMA of BBP helps identify trends. When BBP crosses above the EMA, it may indicate a strengthening bullish trend, while a crossover below the EMA may suggest a bearish trend.
Customization:
The NBBP indicator provides traders with flexibility through customizable settings. Users can adjust the BBP length, EMA length, and choose to activate or deactivate the normalization function based on their trading preferences and strategy.
Limitations:
The NBBP indicator is most effective when used in conjunction with other technical analysis tools and market context. Traders should consider multiple factors when making trading decisions.
Normalization function results may vary depending on the chosen length and market conditions. If the desired result is not achieved through default settings, try changing timeframes or toggling on/off the normalization function. Users should exercise caution and combine it with other indicators and analysis techniques.
In conclusion, the NBBP indicator is a versatile tool that empowers traders to assess market sentiment, identify potential reversals, and follow trends. Its intuitive visualizations, normalization function, and customizable settings make it a valuable addition to any trader's toolkit.
Indicator Overview:
The NBBP indicator calculates Bull Bear Power, which measures the strength of bullish and bearish forces in the market. It does so by taking the difference between the high and the exponential moving average (EMA) of the closing price for a specified length. This raw BBP is represented on the chart as a line.
Key Features:
-- Zero Line: The NBBP indicator introduces a central reference line at zero. This line serves as a pivotal point for interpreting market sentiment. When the BBP line is above zero, it is colored green, indicating a predominance of bullish sentiment. Conversely, when the BBP line is below zero, it turns red, signaling a prevalence of bearish sentiment. This coloration helps traders quickly identify shifts in market sentiment.
-- OPTIONAL Normalization Function: One of the standout features of the NBBP indicator is its optional normalization function. When activated in the settings menu, this function scales the BBP values from -1 to +1. This means that BBP values are adjusted to fit within a standardized range, making it easier for traders to compare sentiment across different timeframes or assets. Normalization is particularly valuable for identifying extreme sentiment conditions and potential reversals.
-- Moving Average: To provide additional context and smooth out BBP fluctuations, the indicator includes an exponential moving average (EMA). The EMA of BBP is plotted on the chart as a white line. Traders can use this moving average to identify trends and potential trend reversals.
-- Fill Between Lines: The indicator visually enhances the BBP by filling the area between the BBP line and the zero line with a translucent color. This fill helps traders visualize the strength and duration of bullish or bearish sentiment.
Interpretation:
-- BBP Line: Traders can assess the raw BBP line for shifts in sentiment. When the line crosses above zero, it may suggest a shift from bearish to bullish sentiment, potentially indicating a buying opportunity. Conversely, when the line crosses below zero, it may signal a shift from bullish to bearish sentiment, suggesting a potential selling opportunity.
-- Normalization Function: The optional normalization function allows traders to gauge sentiment on a standardized scale. Values above 0 indicate bullish sentiment, while values below 0 suggest bearish sentiment. The closer the values are to their polar ends (-1 or +1), the stronger the sentiment.
-- Moving Average: The EMA of BBP helps identify trends. When BBP crosses above the EMA, it may indicate a strengthening bullish trend, while a crossover below the EMA may suggest a bearish trend.
Customization:
The NBBP indicator provides traders with flexibility through customizable settings. Users can adjust the BBP length, EMA length, and choose to activate or deactivate the normalization function based on their trading preferences and strategy.
Limitations:
The NBBP indicator is most effective when used in conjunction with other technical analysis tools and market context. Traders should consider multiple factors when making trading decisions.
Normalization function results may vary depending on the chosen length and market conditions. If the desired result is not achieved through default settings, try changing timeframes or toggling on/off the normalization function. Users should exercise caution and combine it with other indicators and analysis techniques.
In conclusion, the NBBP indicator is a versatile tool that empowers traders to assess market sentiment, identify potential reversals, and follow trends. Its intuitive visualizations, normalization function, and customizable settings make it a valuable addition to any trader's toolkit.
오픈 소스 스크립트
트레이딩뷰의 진정한 정신에 따라, 이 스크립트의 작성자는 이를 오픈소스로 공개하여 트레이더들이 기능을 검토하고 검증할 수 있도록 했습니다. 작성자에게 찬사를 보냅니다! 이 코드는 무료로 사용할 수 있지만, 코드를 재게시하는 경우 하우스 룰이 적용된다는 점을 기억하세요.
면책사항
해당 정보와 게시물은 금융, 투자, 트레이딩 또는 기타 유형의 조언이나 권장 사항으로 간주되지 않으며, 트레이딩뷰에서 제공하거나 보증하는 것이 아닙니다. 자세한 내용은 이용 약관을 참조하세요.
오픈 소스 스크립트
트레이딩뷰의 진정한 정신에 따라, 이 스크립트의 작성자는 이를 오픈소스로 공개하여 트레이더들이 기능을 검토하고 검증할 수 있도록 했습니다. 작성자에게 찬사를 보냅니다! 이 코드는 무료로 사용할 수 있지만, 코드를 재게시하는 경우 하우스 룰이 적용된다는 점을 기억하세요.
면책사항
해당 정보와 게시물은 금융, 투자, 트레이딩 또는 기타 유형의 조언이나 권장 사항으로 간주되지 않으며, 트레이딩뷰에서 제공하거나 보증하는 것이 아닙니다. 자세한 내용은 이용 약관을 참조하세요.