OPEN-SOURCE SCRIPT
IndiaView_IV
Disclaimer- This script is only for education purpose.
This script is special made for indiaview Friends.If u can learn about stock market. u can join. its free and always free of cost.
How to use this indicator-
Rules
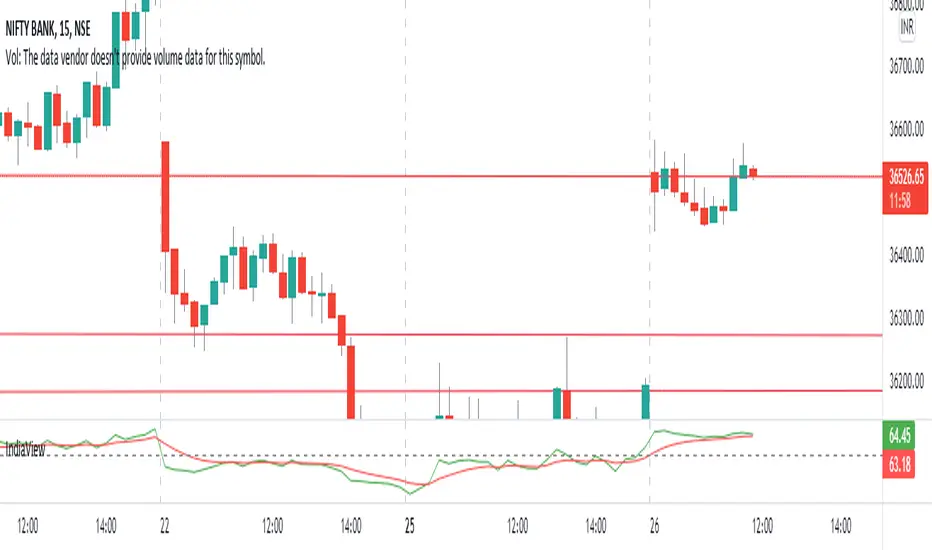
(i) No trend - when both lines are together the there is no trend in the market. only sideways market.
(ii) Bullish Market-Green Line above the red line mean bullish market.
(iii)Bearish Market-Red line above the green line means Bearish market.
50-50 line mean - Rsi line above the 50 the market may go Up. rsi below the 50 the market may go Down.
U Can use the indicator everywhere like Stock, future, options,currency, crypo and any other market.
This script is special made for indiaview Friends.If u can learn about stock market. u can join. its free and always free of cost.
How to use this indicator-
Rules
(i) No trend - when both lines are together the there is no trend in the market. only sideways market.
(ii) Bullish Market-Green Line above the red line mean bullish market.
(iii)Bearish Market-Red line above the green line means Bearish market.
50-50 line mean - Rsi line above the 50 the market may go Up. rsi below the 50 the market may go Down.
U Can use the indicator everywhere like Stock, future, options,currency, crypo and any other market.
오픈 소스 스크립트
트레이딩뷰의 진정한 정신에 따라, 이 스크립트의 작성자는 이를 오픈소스로 공개하여 트레이더들이 기능을 검토하고 검증할 수 있도록 했습니다. 작성자에게 찬사를 보냅니다! 이 코드는 무료로 사용할 수 있지만, 코드를 재게시하는 경우 하우스 룰이 적용된다는 점을 기억하세요.
면책사항
해당 정보와 게시물은 금융, 투자, 트레이딩 또는 기타 유형의 조언이나 권장 사항으로 간주되지 않으며, 트레이딩뷰에서 제공하거나 보증하는 것이 아닙니다. 자세한 내용은 이용 약관을 참조하세요.
오픈 소스 스크립트
트레이딩뷰의 진정한 정신에 따라, 이 스크립트의 작성자는 이를 오픈소스로 공개하여 트레이더들이 기능을 검토하고 검증할 수 있도록 했습니다. 작성자에게 찬사를 보냅니다! 이 코드는 무료로 사용할 수 있지만, 코드를 재게시하는 경우 하우스 룰이 적용된다는 점을 기억하세요.
면책사항
해당 정보와 게시물은 금융, 투자, 트레이딩 또는 기타 유형의 조언이나 권장 사항으로 간주되지 않으며, 트레이딩뷰에서 제공하거나 보증하는 것이 아닙니다. 자세한 내용은 이용 약관을 참조하세요.