OPEN-SOURCE SCRIPT
Advanced 5-Candle Pattern Predictor
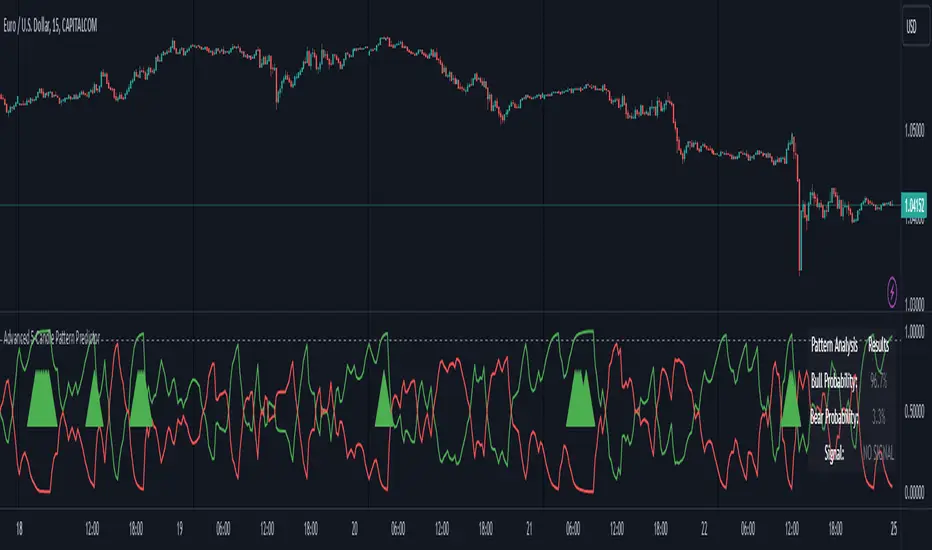
This advanced indicator uses machine learning techniques and multiple analysis methods to predict potential bullish or bearish moves based on the last 5 candles. It combines volume analysis, momentum indicators, and pattern recognition to generate high-probability trading signals.
Key Features:
- Sophisticated 5-candle pattern analysis
- Volume-confirmed signals
- Multi-timeframe trend analysis
- Advanced momentum tracking
- Real-time probability scoring
How It Works:
The indicator analyzes multiple factors for each candle:
1. Body/wick ratios and relationships
2. Volume correlation with price movement
3. Momentum shifts between candles
4. Trend strength and direction
5. Technical indicator confluence (RSI, MACD)
Signals are generated only when:
- Pattern probability exceeds the threshold (default 75%)
- Volume confirms the movement
- Multiple technical factors align
- Trend strength supports the direction
Parameters:
- Probability Threshold: Minimum probability required for signal generation (0.6-1.0)
- Volume Threshold: Required volume multiplication factor (1.0-3.0)
Visual Feedback:
- Green line: Bullish probability
- Red line: Bearish probability
- Gray dashed line: Threshold level
- Large green/red arrows: High-probability signals
- Detailed information table showing current probabilities and signals
Usage Tips:
1. Higher threshold values generate fewer but potentially more reliable signals
2. Look for confluence between probability scores and volume confirmation
3. Use in conjunction with your regular trading strategy for confirmation
4. Best used on timeframes 15m and above for more reliable patterns
Warning:
Past performance does not guarantee future results. This indicator should be used as part of a complete trading strategy with proper risk management.
오픈 소스 스크립트
트레이딩뷰의 진정한 정신에 따라, 이 스크립트의 작성자는 이를 오픈소스로 공개하여 트레이더들이 기능을 검토하고 검증할 수 있도록 했습니다. 작성자에게 찬사를 보냅니다! 이 코드는 무료로 사용할 수 있지만, 코드를 재게시하는 경우 하우스 룰이 적용된다는 점을 기억하세요.
면책사항
해당 정보와 게시물은 금융, 투자, 트레이딩 또는 기타 유형의 조언이나 권장 사항으로 간주되지 않으며, 트레이딩뷰에서 제공하거나 보증하는 것이 아닙니다. 자세한 내용은 이용 약관을 참조하세요.
오픈 소스 스크립트
트레이딩뷰의 진정한 정신에 따라, 이 스크립트의 작성자는 이를 오픈소스로 공개하여 트레이더들이 기능을 검토하고 검증할 수 있도록 했습니다. 작성자에게 찬사를 보냅니다! 이 코드는 무료로 사용할 수 있지만, 코드를 재게시하는 경우 하우스 룰이 적용된다는 점을 기억하세요.
면책사항
해당 정보와 게시물은 금융, 투자, 트레이딩 또는 기타 유형의 조언이나 권장 사항으로 간주되지 않으며, 트레이딩뷰에서 제공하거나 보증하는 것이 아닙니다. 자세한 내용은 이용 약관을 참조하세요.