INVITE-ONLY SCRIPT
업데이트됨 Probability Pivot Points
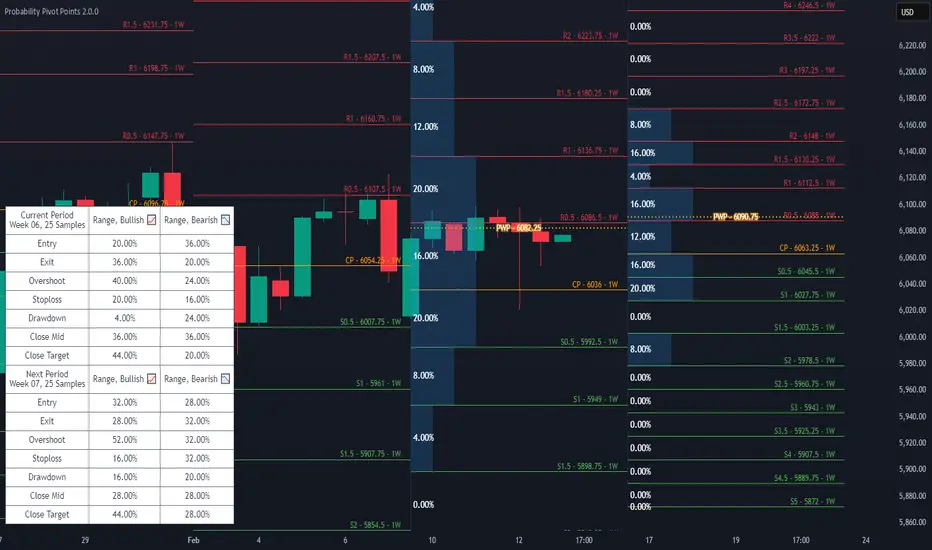
Probability Pivot Points integrates a customizable Pivot Points indicator with conditional probabilities calculated from historical occurrences.
Features
Six different discretionarily Pivot Point Bias strategies utilizing Midpoint Pivot Points in bullish and bearish variants: Standard, Range, Continuation, Counter Trend, Expansion, and Extension.


Next Period's Pivot Points given the current period's OHLC data. Includes settings to use theoretical OHLC values to see what the next period's Pivot Points could look like.


Supports Traditional, Floor, Fibonacci, and Average True Range Pivot Point calculations.

Includes settings to customize the Fibonacci ratios and Average True Range calculations.

Automatically maximize or manually set the number of historical Pivot Points to draw.

Probability visualizations for the Pivot Points based on historical occurrences for the current and upcoming trading periods. The Probability Weighted Pivot (PWP) Point uses the probabilities calculated as weights against every displayed Pivot Point to show a mean of the data.

Load seasonal or non-seasonal historical data to calculate the odds of a High, Low, or Close occurring between any two Pivot Points.

Settings to manually set the weekly, monthly, and quarterly seasonal data loaded into the Pivot Probabilities feature. Automatic detection and loading of the current seasonal period's data is the default behavior. Includes a table that displays the data that's loaded.

Get probabilities for the currently selected Pivot Point Bias strategy.

Check the odds of High, Low, or Close occurrences at the strategy's marked Entry, Exit, or Stop Loss Pivot Points.

Seasonal Filters let you select specific years to sample probabilities from.

Customize pivot colors, width, label size, label color, Bias Entry and Exit Zone colors, Pivot Probability colors, and pick between the Point Five and M Legacy Midpoint label styles.

Auto Timeframe changes the Pivot Points higher timeframe based on the chart timeframe in use. Includes settings to customize what chart timeframes will display specific Pivot Point higher timeframes.

Q: Is this an update to your older Pivot Probabilities indicator?
Pivot Probabilities was designed to require a separately applied Pivot Points indicator to be interpreted and used properly. Probability Pivot Points is designed with an included set of Pivot Pivots that can interact with the probability calculations, which helps make improvements to new calculations and visualizations that Pivot Probabilities was never originally designed to do. Features from Pivot Probabilities are being completely redesigned, reimplemented, and expanded upon as a component in this larger Probability Pivot Points indicator. Anyone with access to the old Pivot Probabilities will also get access to Probability Pivot Points and are considered part of the same package.
Features
Six different discretionarily Pivot Point Bias strategies utilizing Midpoint Pivot Points in bullish and bearish variants: Standard, Range, Continuation, Counter Trend, Expansion, and Extension.
Next Period's Pivot Points given the current period's OHLC data. Includes settings to use theoretical OHLC values to see what the next period's Pivot Points could look like.
Supports Traditional, Floor, Fibonacci, and Average True Range Pivot Point calculations.
Includes settings to customize the Fibonacci ratios and Average True Range calculations.
Automatically maximize or manually set the number of historical Pivot Points to draw.
Probability visualizations for the Pivot Points based on historical occurrences for the current and upcoming trading periods. The Probability Weighted Pivot (PWP) Point uses the probabilities calculated as weights against every displayed Pivot Point to show a mean of the data.
Load seasonal or non-seasonal historical data to calculate the odds of a High, Low, or Close occurring between any two Pivot Points.
Settings to manually set the weekly, monthly, and quarterly seasonal data loaded into the Pivot Probabilities feature. Automatic detection and loading of the current seasonal period's data is the default behavior. Includes a table that displays the data that's loaded.
Get probabilities for the currently selected Pivot Point Bias strategy.
Check the odds of High, Low, or Close occurrences at the strategy's marked Entry, Exit, or Stop Loss Pivot Points.
Seasonal Filters let you select specific years to sample probabilities from.
Customize pivot colors, width, label size, label color, Bias Entry and Exit Zone colors, Pivot Probability colors, and pick between the Point Five and M Legacy Midpoint label styles.
Auto Timeframe changes the Pivot Points higher timeframe based on the chart timeframe in use. Includes settings to customize what chart timeframes will display specific Pivot Point higher timeframes.
Q: Is this an update to your older Pivot Probabilities indicator?
Pivot Probabilities was designed to require a separately applied Pivot Points indicator to be interpreted and used properly. Probability Pivot Points is designed with an included set of Pivot Pivots that can interact with the probability calculations, which helps make improvements to new calculations and visualizations that Pivot Probabilities was never originally designed to do. Features from Pivot Probabilities are being completely redesigned, reimplemented, and expanded upon as a component in this larger Probability Pivot Points indicator. Anyone with access to the old Pivot Probabilities will also get access to Probability Pivot Points and are considered part of the same package.
릴리즈 노트
Version 1.1.0This update adds a Strategy Dashboard, a Custom Pivot Bias option, and quarterly Pivot Probabilities.
Here is a breakdown of everything in the new Strategy Dashboard to help summarize descriptive statistics for each Pivot Bias strategy.
Includes new style settings to customize the color, font, location, and size of the dashboard. You can toggle what strategies and summary statistics to display here as well.
Under the Pivot Bias dropdown setting, you can now select "Custom" and create your own Pivot Bias. Select specific Pivot Points to display and set your own entry and exit locations.
Quarterly probabilities are now available. Switch to a weekly timeframe to automatically pull up a quarterly timeframe, or manually set the indicator to use a 3M timeframe.
릴리즈 노트
Update for the indicator's chart preview!릴리즈 노트
Version 1.1.1- 🆕 New Custom Bias Entry and Exit Zone inputs let you select the upper and lower pivots of the zone independently.
- 🔄 Moved the Probabilities Data Source input closer to the top of the Inputs tab.
릴리즈 노트
Version 1.2.0- 🆕 Add Camarilla Pivot Point calculations.
- 🆕 Add Woodie Pivot Point calculations.
릴리즈 노트
Version 1.2.1- 🐛 Fix an error that prevented the indicator from being applied to new chart layouts.
릴리즈 노트
Version 2.0.0Update indicator to Pine Script™ V6 🎉 All Probability Pivot Point versions that use Pine Script™ V6 now start with 2.X.X.
Probability Pivot Points now includes alert options for individual Pivot Point levels, including the Probability Weighted Pivot.
Alternatively, create multiple alerts using a Pivot Point Bias strategy with the Any alert() function call condition. Which will create alerts for crossing into entry zones and exit zones exit zone, hitting the bias strategy's stop loss, and an optional alert for the Probability Weighted Pivot in the Pivot Probability settings.
Upgraded and simplified the Auto Timeframe settings. Same functionality with one less input and new fallbacks when set incorrectly.
초대 전용 스크립트
이 스크립트는 작성자가 승인한 사용자만 접근할 수 있습니다. 사용하려면 요청 후 승인을 받아야 하며, 일반적으로 결제 후에 허가가 부여됩니다. 자세한 내용은 아래 작성자의 안내를 따르거나 joebaus에게 직접 문의하세요.
트레이딩뷰는 스크립트의 작동 방식을 충분히 이해하고 작성자를 완전히 신뢰하지 않는 이상, 해당 스크립트에 비용을 지불하거나 사용하는 것을 권장하지 않습니다. 커뮤니티 스크립트에서 무료 오픈소스 대안을 찾아보실 수도 있습니다.
작성자 지시 사항
Get access to the indicator through my Whop store at: https://whop.com/bausbenchmarks/ Message me directly on TradingView if you have any questions.
Joe Baus, bausbenchmarks.com
면책사항
해당 정보와 게시물은 금융, 투자, 트레이딩 또는 기타 유형의 조언이나 권장 사항으로 간주되지 않으며, 트레이딩뷰에서 제공하거나 보증하는 것이 아닙니다. 자세한 내용은 이용 약관을 참조하세요.