OPEN-SOURCE SCRIPT
XRP Comparative RSI Indicator - Final Version
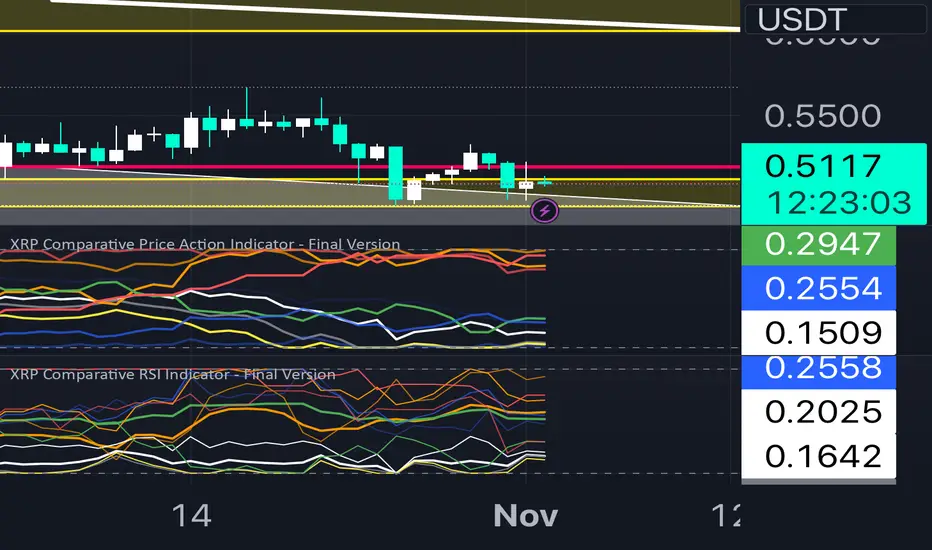
XRP Comparative RSI Indicator - Final Version
The XRP Comparative RSI Indicator offers a dynamic analysis of XRP’s market positioning through relative strength index (RSI) comparisons across various cryptocurrencies and major market indicators. This indicator allows traders and analysts to gauge XRP’s momentum and potential turning points within different market conditions.
Key Features:
• Normalized RSIs: Each RSI value is normalized between 0.00 and 1.00, allowing seamless comparison across multiple assets.
• Grouped Analysis: Three RSI groups provide specific insights:
• Group 1 (XRP-Specific): Measures XRPUSD, XRP Dominance (XRP.D), and XRP/BTC, focusing on XRP’s performance across different trading pairs.
• Group 2 (Market Influence - Bitcoin): Measures BTCUSD, BTC Dominance (BTC.D), and XRP/BTC, capturing the influence of Bitcoin on XRP.
• Group 3 (Liquidity Impact): Measures USDT Dominance (USDT.D), BTCUSD, and ETHUSD, evaluating the liquidity impact from key assets and stablecoins.
• Individual Asset RSIs: Track the normalized RSI for each specific pair or asset, including XRPUSD, BTCUSD, ETHUSD, XRP/BTC, BTC Dominance, ETH Dominance, and the S&P 500.
• Clear Color Coding: Each asset’s RSI is plotted with a unique color scheme, consistent with the first indicator, for easy recognition.
This indicator is ideal for identifying relative strengths, potential entry and exit signals, and understanding how XRP’s momentum aligns or diverges from broader market trends.
오픈 소스 스크립트
트레이딩뷰의 진정한 정신에 따라, 이 스크립트의 작성자는 이를 오픈소스로 공개하여 트레이더들이 기능을 검토하고 검증할 수 있도록 했습니다. 작성자에게 찬사를 보냅니다! 이 코드는 무료로 사용할 수 있지만, 코드를 재게시하는 경우 하우스 룰이 적용된다는 점을 기억하세요.
면책사항
해당 정보와 게시물은 금융, 투자, 트레이딩 또는 기타 유형의 조언이나 권장 사항으로 간주되지 않으며, 트레이딩뷰에서 제공하거나 보증하는 것이 아닙니다. 자세한 내용은 이용 약관을 참조하세요.
오픈 소스 스크립트
트레이딩뷰의 진정한 정신에 따라, 이 스크립트의 작성자는 이를 오픈소스로 공개하여 트레이더들이 기능을 검토하고 검증할 수 있도록 했습니다. 작성자에게 찬사를 보냅니다! 이 코드는 무료로 사용할 수 있지만, 코드를 재게시하는 경우 하우스 룰이 적용된다는 점을 기억하세요.
면책사항
해당 정보와 게시물은 금융, 투자, 트레이딩 또는 기타 유형의 조언이나 권장 사항으로 간주되지 않으며, 트레이딩뷰에서 제공하거나 보증하는 것이 아닙니다. 자세한 내용은 이용 약관을 참조하세요.