OPEN-SOURCE SCRIPT
업데이트됨 Asset Correlation
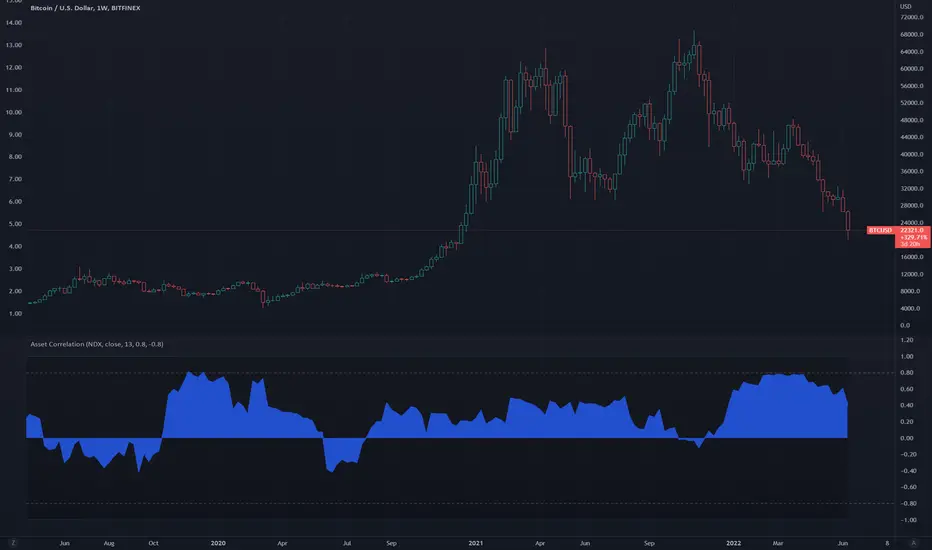
This indicator shows correlation strength between the source asset plotted in the main chart and a user-input asset in the indicator panel. For example, if the main chart panel is displaying BTCUSD and the correlation indicator is NDX, then the correlation strength is plotted as the relationship between the two. A strong positive correlation target is set at 0.80 but can be changed. A strong negative correlation target is set at -0.80 and can also be changed.
The indicator also has an option for a plot of the ta.correlation() function for a reference line.
The indicator also has an option for a plot of the ta.correlation() function for a reference line.
릴리즈 노트
Changes as follows:- Fixed scale issue y axis for reference plot of ta.correlation(), which is hidden by default. As plots can’t be called from a local scope, the transparency of the plot is set to 100 when turned off which previously affected the y axis scale. Update sets ta.correlation() plot value to 0 and transparency to 100, when bShowTradingViewCorrelation is false.
오픈 소스 스크립트
트레이딩뷰의 진정한 정신에 따라, 이 스크립트의 작성자는 이를 오픈소스로 공개하여 트레이더들이 기능을 검토하고 검증할 수 있도록 했습니다. 작성자에게 찬사를 보냅니다! 이 코드는 무료로 사용할 수 있지만, 코드를 재게시하는 경우 하우스 룰이 적용된다는 점을 기억하세요.
면책사항
해당 정보와 게시물은 금융, 투자, 트레이딩 또는 기타 유형의 조언이나 권장 사항으로 간주되지 않으며, 트레이딩뷰에서 제공하거나 보증하는 것이 아닙니다. 자세한 내용은 이용 약관을 참조하세요.
오픈 소스 스크립트
트레이딩뷰의 진정한 정신에 따라, 이 스크립트의 작성자는 이를 오픈소스로 공개하여 트레이더들이 기능을 검토하고 검증할 수 있도록 했습니다. 작성자에게 찬사를 보냅니다! 이 코드는 무료로 사용할 수 있지만, 코드를 재게시하는 경우 하우스 룰이 적용된다는 점을 기억하세요.
면책사항
해당 정보와 게시물은 금융, 투자, 트레이딩 또는 기타 유형의 조언이나 권장 사항으로 간주되지 않으며, 트레이딩뷰에서 제공하거나 보증하는 것이 아닙니다. 자세한 내용은 이용 약관을 참조하세요.