OPEN-SOURCE SCRIPT
VWAP Bands @shrilss
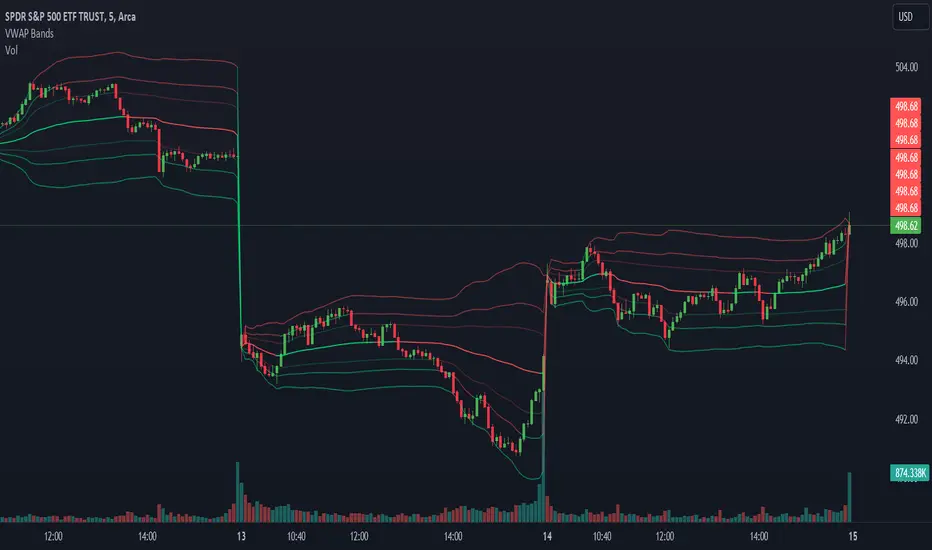
VWAP Bands Integrates VWAP with standard deviation bands to provide traders with insights into potential support and resistance levels based on volume dynamics. VWAP is a key metric used by institutional traders to gauge the average price a security has traded at throughout the trading day, taking into account both price and volume.
This script calculates the VWAP for each trading session and overlays it on the price chart as a solid line. Additionally, it plots multiple standard deviation bands around the VWAP to indicate potential areas of price extension or contraction. These bands are derived from multiplying the standard deviation of price by predetermined factors, offering traders a visual representation of potential price ranges.
This script calculates the VWAP for each trading session and overlays it on the price chart as a solid line. Additionally, it plots multiple standard deviation bands around the VWAP to indicate potential areas of price extension or contraction. These bands are derived from multiplying the standard deviation of price by predetermined factors, offering traders a visual representation of potential price ranges.
오픈 소스 스크립트
트레이딩뷰의 진정한 정신에 따라, 이 스크립트의 작성자는 이를 오픈소스로 공개하여 트레이더들이 기능을 검토하고 검증할 수 있도록 했습니다. 작성자에게 찬사를 보냅니다! 이 코드는 무료로 사용할 수 있지만, 코드를 재게시하는 경우 하우스 룰이 적용된다는 점을 기억하세요.
면책사항
해당 정보와 게시물은 금융, 투자, 트레이딩 또는 기타 유형의 조언이나 권장 사항으로 간주되지 않으며, 트레이딩뷰에서 제공하거나 보증하는 것이 아닙니다. 자세한 내용은 이용 약관을 참조하세요.
오픈 소스 스크립트
트레이딩뷰의 진정한 정신에 따라, 이 스크립트의 작성자는 이를 오픈소스로 공개하여 트레이더들이 기능을 검토하고 검증할 수 있도록 했습니다. 작성자에게 찬사를 보냅니다! 이 코드는 무료로 사용할 수 있지만, 코드를 재게시하는 경우 하우스 룰이 적용된다는 점을 기억하세요.
면책사항
해당 정보와 게시물은 금융, 투자, 트레이딩 또는 기타 유형의 조언이나 권장 사항으로 간주되지 않으며, 트레이딩뷰에서 제공하거나 보증하는 것이 아닙니다. 자세한 내용은 이용 약관을 참조하세요.