OPEN-SOURCE SCRIPT
Candle Shape
Candle Shape
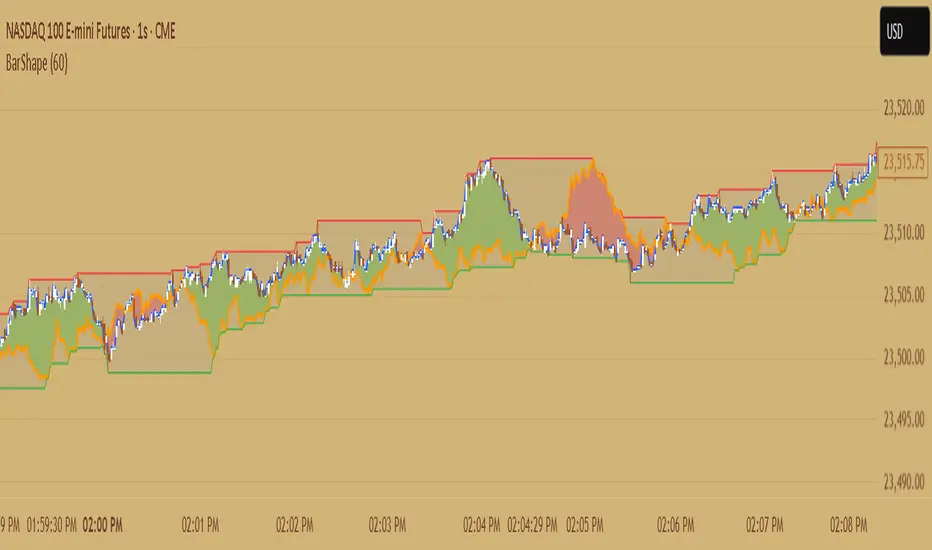
This indicator visualizes rolling candles that aggregate price action over a chosen lookback period, allowing you to see how OHLC dynamics evolve in real time.
Instead of waiting for a higher timeframe (HTF) bar to close, you can track its development directly from a lower timeframe chart.
For example, view how a 1-hour candle is forming on a 1-minute chart — complete with rolling open, high, low, and close levels, as well as colored body and wick areas.
---
🔹 How it works
- Lookback Period (n) → sets the bucket size, defining how many bars are merged into a “meta-candle.”
- The script continuously updates the meta-open, meta-high, meta-low, and meta-close.
- Body and wick areas are filled with color, making bullish/bearish transitions easy to follow.
---
🔹 Use cases
- Monitor the intra-development of higher timeframe candles.
- Analyze rolling OHLC structures to understand how price dynamics shift across different aggregation windows.
- Explore unique perspectives for strategy confirmation, breakout anticipation, and market structure analysis.
---
✨ Candle Shape bridges the gap between timeframes and uncovers new layers of price interaction.
오픈 소스 스크립트
트레이딩뷰의 진정한 정신에 따라, 이 스크립트의 작성자는 이를 오픈소스로 공개하여 트레이더들이 기능을 검토하고 검증할 수 있도록 했습니다. 작성자에게 찬사를 보냅니다! 이 코드는 무료로 사용할 수 있지만, 코드를 재게시하는 경우 하우스 룰이 적용된다는 점을 기억하세요.
면책사항
해당 정보와 게시물은 금융, 투자, 트레이딩 또는 기타 유형의 조언이나 권장 사항으로 간주되지 않으며, 트레이딩뷰에서 제공하거나 보증하는 것이 아닙니다. 자세한 내용은 이용 약관을 참조하세요.
오픈 소스 스크립트
트레이딩뷰의 진정한 정신에 따라, 이 스크립트의 작성자는 이를 오픈소스로 공개하여 트레이더들이 기능을 검토하고 검증할 수 있도록 했습니다. 작성자에게 찬사를 보냅니다! 이 코드는 무료로 사용할 수 있지만, 코드를 재게시하는 경우 하우스 룰이 적용된다는 점을 기억하세요.
면책사항
해당 정보와 게시물은 금융, 투자, 트레이딩 또는 기타 유형의 조언이나 권장 사항으로 간주되지 않으며, 트레이딩뷰에서 제공하거나 보증하는 것이 아닙니다. 자세한 내용은 이용 약관을 참조하세요.