OPEN-SOURCE SCRIPT
Percent Change Indicator
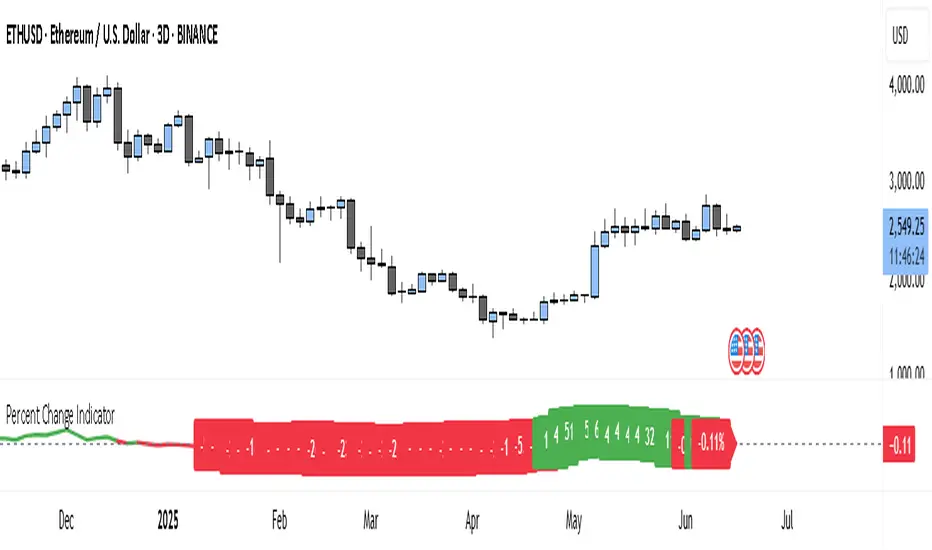
The Percent Change Indicator helps you see how much the price of an asset has changed over a specific number of bars (or candles) on the chart. You get to decide how many bars to look back — for example, the last 10 candles. The indicator takes the current closing price and compares it to the closing price from 10 bars ago, then calculates the percentage difference between the two.
If the price has increased, the indicator shows a positive value and displays it in green. If the price has dropped, the value is negative and shown in red. A horizontal zero line helps you quickly see whether the market is gaining or losing value over the selected period.
On your chart, this indicator appears as a line that moves up or down with the price trend. It updates in real time and works on all timeframes — so whether you're trading on the 1-minute chart or analyzing the daily chart, it always tells you how much the price has changed over the number of bars you chose.
This tool is especially useful for spotting trends, measuring price momentum, or identifying when the market is starting to reverse direction.
오픈 소스 스크립트
트레이딩뷰의 진정한 정신에 따라, 이 스크립트의 작성자는 이를 오픈소스로 공개하여 트레이더들이 기능을 검토하고 검증할 수 있도록 했습니다. 작성자에게 찬사를 보냅니다! 이 코드는 무료로 사용할 수 있지만, 코드를 재게시하는 경우 하우스 룰이 적용된다는 점을 기억하세요.
Trade forex, indices, stocks and metals with up to US$100.000 in company's funding.
Complete a challenge to access funding or go for instant deposit.
Trading involves substantial risk. Not financial advice
Complete a challenge to access funding or go for instant deposit.
Trading involves substantial risk. Not financial advice
면책사항
해당 정보와 게시물은 금융, 투자, 트레이딩 또는 기타 유형의 조언이나 권장 사항으로 간주되지 않으며, 트레이딩뷰에서 제공하거나 보증하는 것이 아닙니다. 자세한 내용은 이용 약관을 참조하세요.