OPEN-SOURCE SCRIPT
MFI- Momentum Fusion Indicator
Indicator Overview
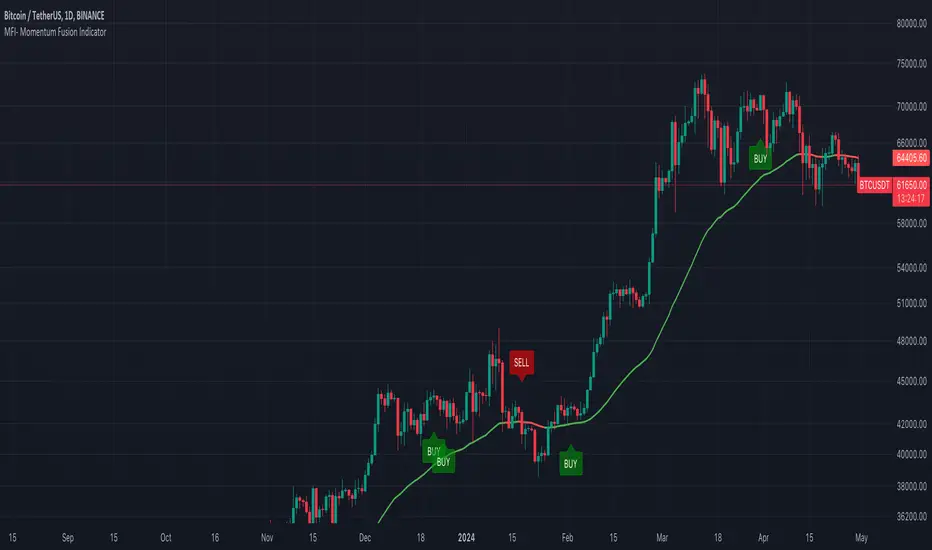
The "MFI - Momentum Fusion Indicator" is a comprehensive trading tool designed for TradingView that combines several technical analysis methods to assist traders in identifying potential buy and sell opportunities in financial markets.
Key Components
Moving Averages (MA): Uses two Simple Moving Averages (SMA) with periods defined by the user (default 10 and 20). The indicator generates buy signals when the shorter MA (MA 10) crosses above the longer MA (MA 20) and sell signals when it crosses below, helping to pinpoint trend reversals.
Relative Strength Index (RSI): A momentum oscillator that helps identify overbought or oversold conditions, adding a layer of confirmation to the signals generated by the moving averages.
Exponential Moving Average (EMA 50): Used to gauge the medium-term trend direction. The color of the EMA line changes based on whether the trend is up (green) or down (red), providing a visual representation of the market trend.
Average True Range (ATR): This component measures market volatility. Signals are only generated when the ATR confirms significant market movement relative to the EMA50, enhancing the reliability of the signals during volatile conditions.
How It Works
Signal Generation: The core of the indicator is based on the crossover of two SMAs. A buy signal is issued when the short-term MA crosses above the long-term MA during sufficient market volatility (confirmed by ATR). Conversely, a sell signal is triggered when the short-term MA crosses below the long-term MA under similar conditions.
Trend Confirmation: The EMA50 helps confirm the broader market trend, while the ATR ensures that the crossover signals occur during periods of meaningful price movement, filtering out noise and less significant price movements.
Use Case
For Traders: The indicator is ideal for traders who need clear, actionable signals combined with an assessment of market conditions. It’s particularly useful in markets where understanding volatility and momentum is crucial, such as in cryptocurrencies and forex.
Benefits
Comprehensive Analysis: Combines trend, momentum, and volatility analysis in one tool, providing a multifaceted approach to the markets.
Enhanced Decision-Making: By integrating multiple indicators, it reduces the likelihood of false signals and enhances decision-making confidence.
Customizable and Dynamic: Allows for easy adjustment of parameters to fit different trading styles and market conditions.
This indicator equips traders with a powerful blend of tools to analyze price movements and make informed trading decisions based on a combination of trend, momentum, and volatility insights.
오픈 소스 스크립트
트레이딩뷰의 진정한 정신에 따라, 이 스크립트의 작성자는 이를 오픈소스로 공개하여 트레이더들이 기능을 검토하고 검증할 수 있도록 했습니다. 작성자에게 찬사를 보냅니다! 이 코드는 무료로 사용할 수 있지만, 코드를 재게시하는 경우 하우스 룰이 적용된다는 점을 기억하세요.
면책사항
해당 정보와 게시물은 금융, 투자, 트레이딩 또는 기타 유형의 조언이나 권장 사항으로 간주되지 않으며, 트레이딩뷰에서 제공하거나 보증하는 것이 아닙니다. 자세한 내용은 이용 약관을 참조하세요.
오픈 소스 스크립트
트레이딩뷰의 진정한 정신에 따라, 이 스크립트의 작성자는 이를 오픈소스로 공개하여 트레이더들이 기능을 검토하고 검증할 수 있도록 했습니다. 작성자에게 찬사를 보냅니다! 이 코드는 무료로 사용할 수 있지만, 코드를 재게시하는 경우 하우스 룰이 적용된다는 점을 기억하세요.
면책사항
해당 정보와 게시물은 금융, 투자, 트레이딩 또는 기타 유형의 조언이나 권장 사항으로 간주되지 않으며, 트레이딩뷰에서 제공하거나 보증하는 것이 아닙니다. 자세한 내용은 이용 약관을 참조하세요.