PROTECTED SOURCE SCRIPT
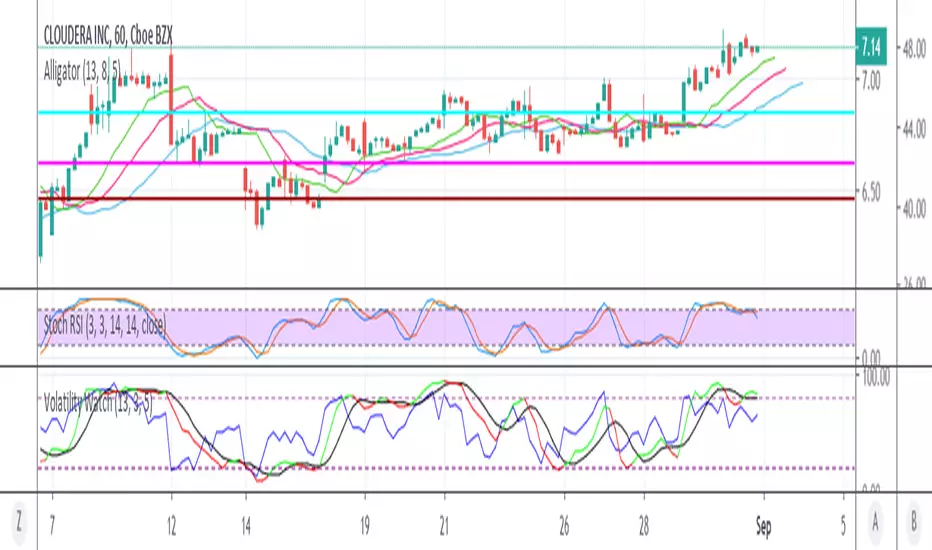
Volatility Watch

READ ME FOR INSTRUCTIONS ==>
Has been tested on Stocks, Crypto, and other Currencies
Get help to find trade ideas!! => I look for Daily conditions to be oversold (Signal and Stochastic to be under low- line with Strength moving up)
DIRECTIONS ==>
PART 1 --> When SIGNAL line turns green and STRENGTH line (blue line) are both greater than or equal to the SLOW STOCHASTIC (Black line) -- This indicates Bullish Trend
PART 2 --> IF SIGNAL line, Strength line, and Slow Stochastic are Below the LOW-LINE (Marked at 20) this is an indication of "Oversold" conditions.
PART 3 --> IF SIGNAL line crosses above Slow Stochastic while they are both below the LOW-LINE (Purple dashed line) and Strength line (blue line) has already
crossed above Slow Stochastic line (black line), this indicates a potential buying opportunity and...
depending on time frame the user could use this indicator to accumulate for Long position, day trade the 2 minute chart, or swing trade.
- Signal = Green (bullish) Red (bearish)
- Strength indicator = Blue line
- Slow Stochastic = Black line
- Low- line = Purple dashed
- High- line = Red dashed
Has been tested on Stocks, Crypto, and other Currencies
Get help to find trade ideas!! => I look for Daily conditions to be oversold (Signal and Stochastic to be under low- line with Strength moving up)
DIRECTIONS ==>
PART 1 --> When SIGNAL line turns green and STRENGTH line (blue line) are both greater than or equal to the SLOW STOCHASTIC (Black line) -- This indicates Bullish Trend
PART 2 --> IF SIGNAL line, Strength line, and Slow Stochastic are Below the LOW-LINE (Marked at 20) this is an indication of "Oversold" conditions.
PART 3 --> IF SIGNAL line crosses above Slow Stochastic while they are both below the LOW-LINE (Purple dashed line) and Strength line (blue line) has already
crossed above Slow Stochastic line (black line), this indicates a potential buying opportunity and...
depending on time frame the user could use this indicator to accumulate for Long position, day trade the 2 minute chart, or swing trade.
면책사항
이 정보와 게시물은 TradingView에서 제공하거나 보증하는 금융, 투자, 거래 또는 기타 유형의 조언이나 권고 사항을 의미하거나 구성하지 않습니다. 자세한 내용은 이용 약관을 참고하세요.