OPEN-SOURCE SCRIPT
업데이트됨 High Volume Price Levels x3
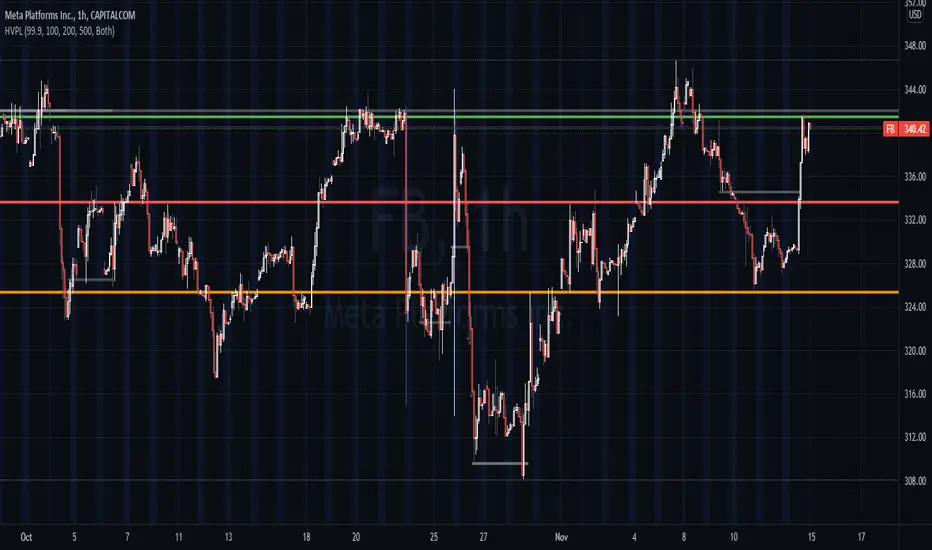
This script detects recent huge volume areas to help you finding out good support and resistance levels.
For each of the3 periods (defaults : 100, 200, 500) a new line will be drawn from the last time the volume amount exceeded n% (default 99%) of the highest volume on the same period, to the next occurence.
Most of time, these lines represent strong support and resistance levels which can be helpful in your technical analysis.
Options:
Notes:
* Sometimes, the last detected level from every periods can be the same at the same moment. In this situation, you'll only see one or two of the lines instead of three.
* I'd like to figure out how to continuously draw every interesting levels without making the chart unreadable. Of course this script will be updated if I find a good way to do it.
* Feel free to suggest any improvements/modifications.
Example:

For each of the3 periods (defaults : 100, 200, 500) a new line will be drawn from the last time the volume amount exceeded n% (default 99%) of the highest volume on the same period, to the next occurence.
Most of time, these lines represent strong support and resistance levels which can be helpful in your technical analysis.
Options:
- Volume trigger level: represents the minimum % of the highest volume within the given period on which you want to draw a new price level. (But higher this % is, stronger the levels will be)
- Periods: The reference periods for high volume detection.
- Show period: Enable/Disable the use of any period.
- Period Color: Select a color correspondig to each period.
- Show current levels only: Disable drawing of previous levels, to display current levels only.
- Extend last level: Extend current lines to right/left/both or none sides of your chart.
Notes:
* Sometimes, the last detected level from every periods can be the same at the same moment. In this situation, you'll only see one or two of the lines instead of three.
* I'd like to figure out how to continuously draw every interesting levels without making the chart unreadable. Of course this script will be updated if I find a good way to do it.
* Feel free to suggest any improvements/modifications.
Example:
릴리즈 노트
Demo chart updated. Previous levels drawn릴리즈 노트
- Corrected mistyped short title
- A "Ghost lines" option that extend 3rd period price lines has been added (activated by default)
- Previous levels are now colored in gray
릴리즈 노트
Fix wrong operator in the previous update 1min (ago)릴리즈 노트
fix: old lines corresponding to 3rd price level still in red instead of gray when ghost lines are disabled릴리즈 노트
fix: tiny display bug for period1 linefix: removing useless empty lines
fix: any line width is now fixed to 3
오픈 소스 스크립트
트레이딩뷰의 진정한 정신에 따라, 이 스크립트의 작성자는 이를 오픈소스로 공개하여 트레이더들이 기능을 검토하고 검증할 수 있도록 했습니다. 작성자에게 찬사를 보냅니다! 이 코드는 무료로 사용할 수 있지만, 코드를 재게시하는 경우 하우스 룰이 적용된다는 점을 기억하세요.
면책사항
해당 정보와 게시물은 금융, 투자, 트레이딩 또는 기타 유형의 조언이나 권장 사항으로 간주되지 않으며, 트레이딩뷰에서 제공하거나 보증하는 것이 아닙니다. 자세한 내용은 이용 약관을 참조하세요.
오픈 소스 스크립트
트레이딩뷰의 진정한 정신에 따라, 이 스크립트의 작성자는 이를 오픈소스로 공개하여 트레이더들이 기능을 검토하고 검증할 수 있도록 했습니다. 작성자에게 찬사를 보냅니다! 이 코드는 무료로 사용할 수 있지만, 코드를 재게시하는 경우 하우스 룰이 적용된다는 점을 기억하세요.
면책사항
해당 정보와 게시물은 금융, 투자, 트레이딩 또는 기타 유형의 조언이나 권장 사항으로 간주되지 않으며, 트레이딩뷰에서 제공하거나 보증하는 것이 아닙니다. 자세한 내용은 이용 약관을 참조하세요.