OPEN-SOURCE SCRIPT
Baekdoo golden diamond signal
Hi forks,
I'm trader Baekdoosan who trading Equity from South Korea. This Baekdoo golden Diamond signal indicate good buying position to trade.
Here's the ideas
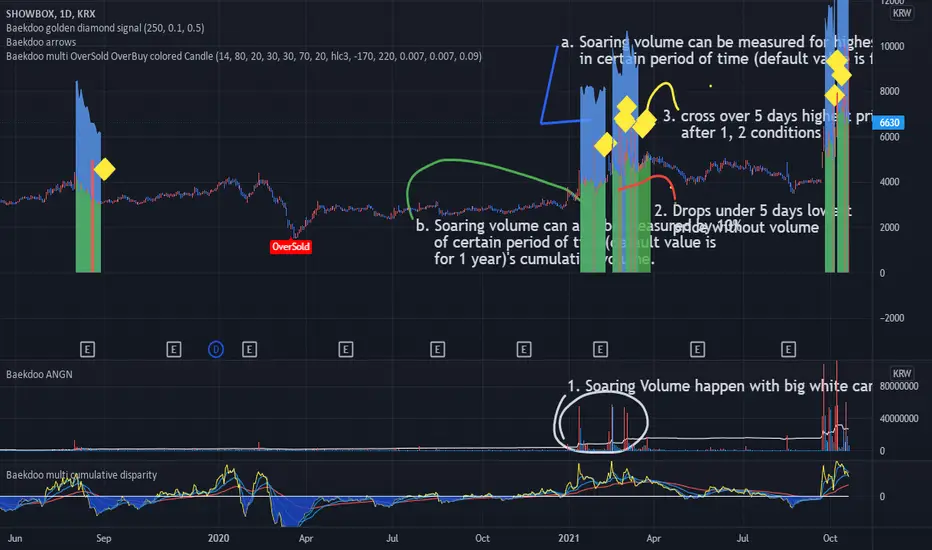
1. Soaring volume happen with big white candle.
a. Soaring volume can be measured for highest volume in certain period of time (default value is for 1 year). (blue area)
b. Soaring volume can also be measured by 10% of certain period of time(default value is for 1 year)'s cumulative volume . (green area) => you can adjust this ratio input. the higher value is the more likely to trail of whale
2. Drops under 5 days lowest price without volume . (red area) => I put half of average volume as default but you may can adjust it (the lower value is the more likely to soar again)
3. cross over 5 days highest price after 1, 2 conditions => Golden Diamond
underneath of this idea is, big chunk of the money comes and correction is on going but major whale's amount hold tight.
you can modify input values based on your investigation. It works well on day chart as well as minute chart. for the area with breaks plots are to checking the 1,2 conditions. so for final indicator will only be shown from this indicator but you can select plots if you think that is useful.
hope this will help your trading on equity as well as crypto. I didn't try it on futures . Best of luck all of you. Gazua~!
I'm trader Baekdoosan who trading Equity from South Korea. This Baekdoo golden Diamond signal indicate good buying position to trade.
Here's the ideas
1. Soaring volume happen with big white candle.
a. Soaring volume can be measured for highest volume in certain period of time (default value is for 1 year). (blue area)
b. Soaring volume can also be measured by 10% of certain period of time(default value is for 1 year)'s cumulative volume . (green area) => you can adjust this ratio input. the higher value is the more likely to trail of whale
2. Drops under 5 days lowest price without volume . (red area) => I put half of average volume as default but you may can adjust it (the lower value is the more likely to soar again)
3. cross over 5 days highest price after 1, 2 conditions => Golden Diamond
underneath of this idea is, big chunk of the money comes and correction is on going but major whale's amount hold tight.
you can modify input values based on your investigation. It works well on day chart as well as minute chart. for the area with breaks plots are to checking the 1,2 conditions. so for final indicator will only be shown from this indicator but you can select plots if you think that is useful.
hope this will help your trading on equity as well as crypto. I didn't try it on futures . Best of luck all of you. Gazua~!
오픈 소스 스크립트
트레이딩뷰의 진정한 정신에 따라, 이 스크립트의 작성자는 이를 오픈소스로 공개하여 트레이더들이 기능을 검토하고 검증할 수 있도록 했습니다. 작성자에게 찬사를 보냅니다! 이 코드는 무료로 사용할 수 있지만, 코드를 재게시하는 경우 하우스 룰이 적용된다는 점을 기억하세요.
면책사항
해당 정보와 게시물은 금융, 투자, 트레이딩 또는 기타 유형의 조언이나 권장 사항으로 간주되지 않으며, 트레이딩뷰에서 제공하거나 보증하는 것이 아닙니다. 자세한 내용은 이용 약관을 참조하세요.
오픈 소스 스크립트
트레이딩뷰의 진정한 정신에 따라, 이 스크립트의 작성자는 이를 오픈소스로 공개하여 트레이더들이 기능을 검토하고 검증할 수 있도록 했습니다. 작성자에게 찬사를 보냅니다! 이 코드는 무료로 사용할 수 있지만, 코드를 재게시하는 경우 하우스 룰이 적용된다는 점을 기억하세요.
면책사항
해당 정보와 게시물은 금융, 투자, 트레이딩 또는 기타 유형의 조언이나 권장 사항으로 간주되지 않으며, 트레이딩뷰에서 제공하거나 보증하는 것이 아닙니다. 자세한 내용은 이용 약관을 참조하세요.