INVITE-ONLY SCRIPT
업데이트됨 MCDX Pro+ | BMS
Published 10 June 2021
MCDX Pro+ | BMS
Bull Momentum System Pro
Use this indicators with other BMS indicators.
(Smart Power / MC Pro++ / SMI Pro+)
How to use:
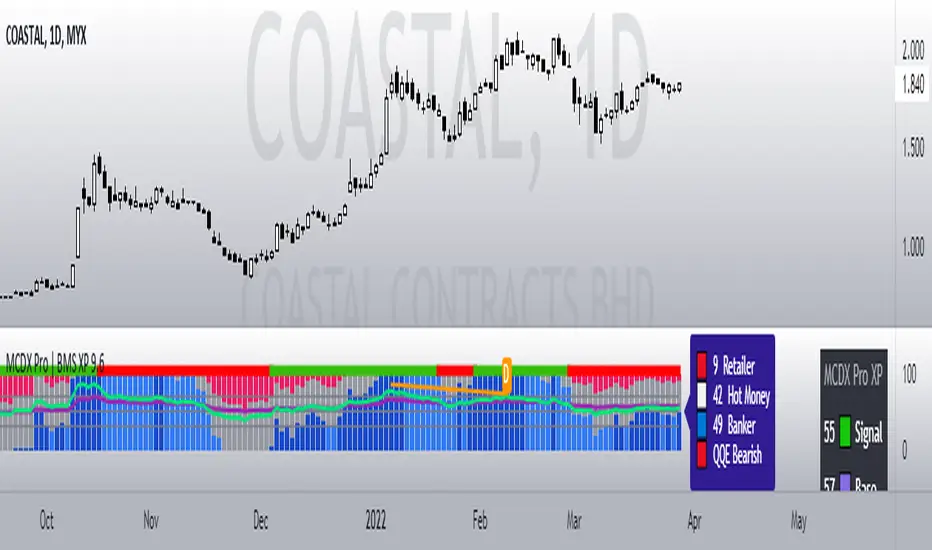
This indicator detects Banker volume.
Green Bars = Retailer ( Bearish / Downtrend)
Gray Bars = Hot Money (Sideways / FIFO)
Red Bars = Banker Smart Money ( Bullish Uptrend)
Pink Bars = Weak Banker (Pullback / Unloading / Technical Rebound)
Blue line = FIFO entry
- Blue line is a fast signal to enter when there is no banker yet.
- Good for BTST / FIFO trade.
- If Blue Line is up too strong a fast pullback may happen
- Yellow line = Bearish (pullback)
- Blue line up together with Red bars means strong bullish.
Overbought / Oversold symbol:
Orange Circle = Overbought / Possible very strong bull
Blue Circle = Oversold / Possible bottom catch / Rebound
Banker levels and Rocket symbol:
Level 0% = No Banker show 0 Rocket
Level 25% = Banker step-in show 1 Rocket
Level 50% = Banker build position show 2 Rocket
Level 75% = Banker takes control show 3 Rocket
Level 100% = Banker overbought show 4 Rocket
Best entry when position is Oversold and Red Banker step-in
and build-up position more than 50% level.
Take profit when Overbought, Pink Bars (banker unloading) and
Blue line turns Yellow line.
MCDX Pro+ | BMS
Bull Momentum System Pro
Use this indicators with other BMS indicators.
(Smart Power / MC Pro++ / SMI Pro+)
How to use:
This indicator detects Banker volume.
Green Bars = Retailer ( Bearish / Downtrend)
Gray Bars = Hot Money (Sideways / FIFO)
Red Bars = Banker Smart Money ( Bullish Uptrend)
Pink Bars = Weak Banker (Pullback / Unloading / Technical Rebound)
Blue line = FIFO entry
- Blue line is a fast signal to enter when there is no banker yet.
- Good for BTST / FIFO trade.
- If Blue Line is up too strong a fast pullback may happen
- Yellow line = Bearish (pullback)
- Blue line up together with Red bars means strong bullish.
Overbought / Oversold symbol:
Orange Circle = Overbought / Possible very strong bull
Blue Circle = Oversold / Possible bottom catch / Rebound
Banker levels and Rocket symbol:
Level 0% = No Banker show 0 Rocket
Level 25% = Banker step-in show 1 Rocket
Level 50% = Banker build position show 2 Rocket
Level 75% = Banker takes control show 3 Rocket
Level 100% = Banker overbought show 4 Rocket
Best entry when position is Oversold and Red Banker step-in
and build-up position more than 50% level.
Take profit when Overbought, Pink Bars (banker unloading) and
Blue line turns Yellow line.
릴리즈 노트
Add RSI line and algorithm.릴리즈 노트
Upgraded to version 3 now with RSI Divergence alert.릴리즈 노트
Add top horizontal RSI bull bear line.릴리즈 노트
New smart color line and divergence line.릴리즈 노트
Code optimization.릴리즈 노트
Add Stoc & RSI color icon on info panel, sensitivity algorithm and color settings.릴리즈 노트
Minor cosmetic fixed.릴리즈 노트
Updated to XP version with ID-VWAP switch mode.릴리즈 노트
New VL (Volatility Line) color RED = Pullback / BLUE = Bullish.Removed ID-VWAP switch, one mode works in different time-frames.
Smoothed Stochastic line reduced noise.
릴리즈 노트
Updated to Pine Script v5. New HMA line and %R line indicator.릴리즈 노트
Reinvented the MCDX with new color scheme. Smoothed RMA line and high accuracy QQE range filter.릴리즈 노트
Double RSI now integrates with MCDX.초대 전용 스크립트
이 스크립트는 작성자가 승인한 사용자만 접근할 수 있습니다. 사용하려면 요청 후 승인을 받아야 하며, 일반적으로 결제 후에 허가가 부여됩니다. 자세한 내용은 아래 작성자의 안내를 따르거나 gwhoe에게 직접 문의하세요.
트레이딩뷰는 스크립트의 작동 방식을 충분히 이해하고 작성자를 완전히 신뢰하지 않는 이상, 해당 스크립트에 비용을 지불하거나 사용하는 것을 권장하지 않습니다. 커뮤니티 스크립트에서 무료 오픈소스 대안을 찾아보실 수도 있습니다.
작성자 지시 사항
Private message me to gain access. Also can Telegram PM @ KLSESG.
면책사항
해당 정보와 게시물은 금융, 투자, 트레이딩 또는 기타 유형의 조언이나 권장 사항으로 간주되지 않으며, 트레이딩뷰에서 제공하거나 보증하는 것이 아닙니다. 자세한 내용은 이용 약관을 참조하세요.
초대 전용 스크립트
이 스크립트는 작성자가 승인한 사용자만 접근할 수 있습니다. 사용하려면 요청 후 승인을 받아야 하며, 일반적으로 결제 후에 허가가 부여됩니다. 자세한 내용은 아래 작성자의 안내를 따르거나 gwhoe에게 직접 문의하세요.
트레이딩뷰는 스크립트의 작동 방식을 충분히 이해하고 작성자를 완전히 신뢰하지 않는 이상, 해당 스크립트에 비용을 지불하거나 사용하는 것을 권장하지 않습니다. 커뮤니티 스크립트에서 무료 오픈소스 대안을 찾아보실 수도 있습니다.
작성자 지시 사항
Private message me to gain access. Also can Telegram PM @ KLSESG.
면책사항
해당 정보와 게시물은 금융, 투자, 트레이딩 또는 기타 유형의 조언이나 권장 사항으로 간주되지 않으며, 트레이딩뷰에서 제공하거나 보증하는 것이 아닙니다. 자세한 내용은 이용 약관을 참조하세요.