PROTECTED SOURCE SCRIPT
업데이트됨 BTC Time Cycle
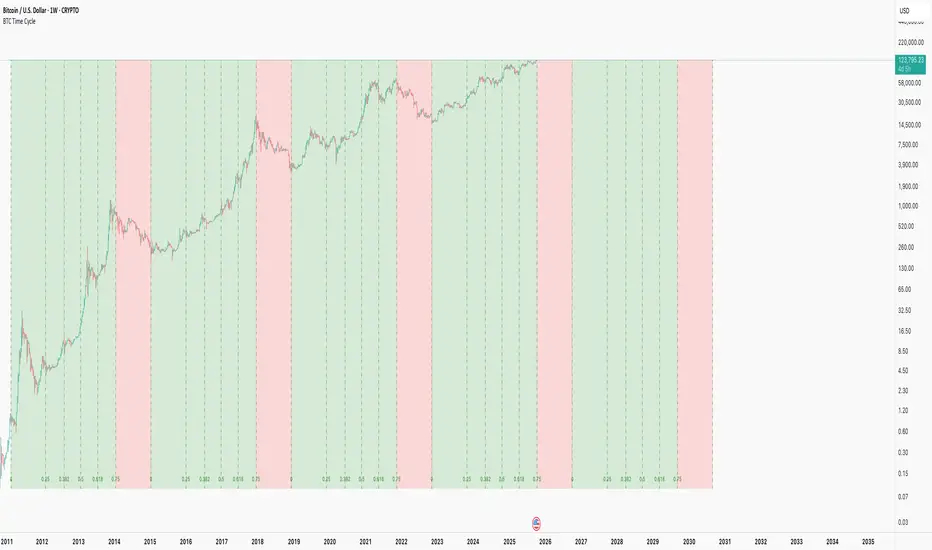
This indicator helps track Bitcoin's historical four-year cycles by dividing time from market bottoms into Fibonacci-based segments, providing clear visual cues for potential bullish and bearish phases.
How It Works: This indicator overlays repeating Fibonacci-based time cycles onto weekly BTC charts, plotting vertical lines at key Fib ratios (0, 0.25, 0.382, 0.5, 0.618, 0.75, 1.0) to track cycle progress. Each cycle concludes at 1.0 and seamlessly resets as the next cycle's 0, capturing historical trough-to-trough intervals like those observed from 2018 to 2022. The week preceding the 0.75 Fibonacci ratio typically signals the cycle peak and bear market onset, transitioning through the final phase until 1.0 initiates a new cycle.
Disclaimer: This pattern has consistently repeated in past cycles, but financial markets are inherently unpredictable—it is not guaranteed to persist and remains valid only until disproven. Treat it as an analytical aid, not a predictive certainty.
This is merely a curiosity and is: True until it isn't™
릴리즈 노트
This indicator helps track Bitcoin's historical four-year cycles by dividing time from market bottoms into Fibonacci-based segments, providing clear visual cues for potential bullish and bearish phases.How It Works: This indicator overlays repeating Fibonacci-based time cycles onto weekly BTC charts, plotting vertical lines at key Fib ratios (0, 0.25, 0.382, 0.5, 0.618, 0.75, 1.0) to track cycle progress. Each cycle concludes at 1.0 and seamlessly resets as the next cycle's 0, capturing historical trough-to-trough intervals like those observed from 2018 to 2022. The week preceding the 0.75 Fibonacci ratio typically signals the cycle peak and bear market onset, transitioning through the final phase until 1.0 initiates a new cycle.
Disclaimer: This pattern has consistently repeated in past cycles, but financial markets are inherently unpredictable—it is not guaranteed to persist and remains valid only until disproven. Treat it as an analytical aid, not a predictive certainty.
This is merely a curiosity and is: True until it isn't™
보호된 스크립트입니다
이 스크립트는 비공개 소스로 게시됩니다. 하지만 이를 자유롭게 제한 없이 사용할 수 있습니다 – 자세한 내용은 여기에서 확인하세요.
면책사항
해당 정보와 게시물은 금융, 투자, 트레이딩 또는 기타 유형의 조언이나 권장 사항으로 간주되지 않으며, 트레이딩뷰에서 제공하거나 보증하는 것이 아닙니다. 자세한 내용은 이용 약관을 참조하세요.
면책사항
해당 정보와 게시물은 금융, 투자, 트레이딩 또는 기타 유형의 조언이나 권장 사항으로 간주되지 않으며, 트레이딩뷰에서 제공하거나 보증하는 것이 아닙니다. 자세한 내용은 이용 약관을 참조하세요.