INVITE-ONLY SCRIPT
업데이트됨 Blockcircle Waveform Bands
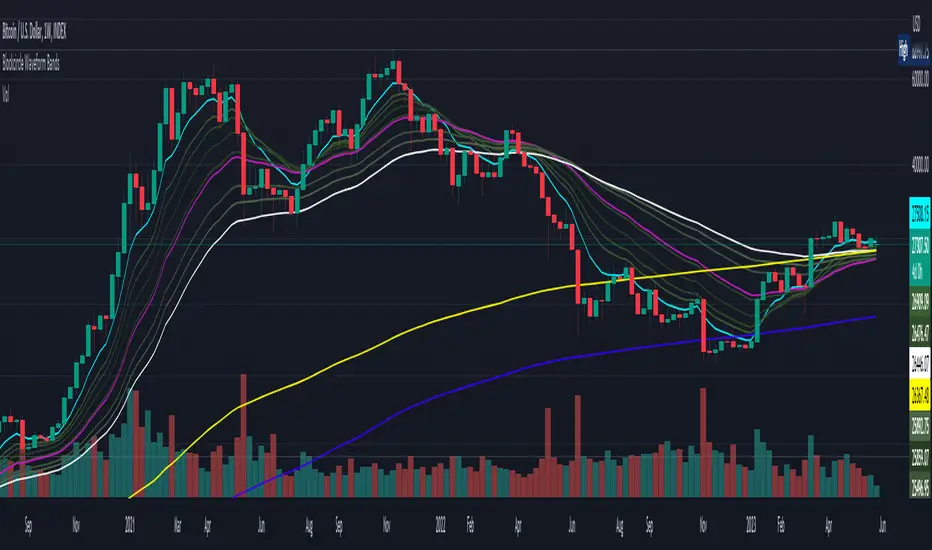
This is a Multi-Band Moving Average Indicator, a versatile and custom technical analysis tool that enables traders to monitor various moving average bands to make well-informed decisions about their asset investments. By examining the relationships between simple moving averages (SMAs) and exponential moving averages (EMAs) of different periods, traders can gain deeper insights into market trends, allowing them to identify potential entry and exit points with greater accuracy.
This comprehensive indicator combines the benefits of both lagging and leading indicators, with SMAs providing a more stable overview of historical price trends, while EMAs respond more swiftly to recent price movements. Users can easily configure the exact periods for each moving average in the indicator's parameter settings, tailoring the tool to their individual preferences and trading strategies.
Understanding the relationship between various moving averages, such as the 10-Day SMA and 50-Day SMA, or the 1-Day and 10-Day SMA, allows traders to gauge short-term trends relative to long-term trends. For instance, when the 10-Day SMA crosses above the 50-Day SMA, it may signal a bullish trend, whereas a cross below the 50-Day SMA might indicate a bearish market.
Similarly, examining the connection between the 1-Week SMA and the 200-Week SMA can provide valuable information on long-term trends and potential trend reversals, further enhancing traders' abilities to make informed decisions.
We, at Blockcircle, like to say that "easy mode" is when the current price is decisively closing above the 8 Month EMA and has successfully retested that level, at that point, we typically have a few months of blissful green up and up
릴리즈 노트
Optimized the code and improved the stylistic output릴리즈 노트
Updated the EMA-35 to EMA-30 in both the default value in the Inputs and the Style (displayed output) as that is much more useful to track trends. It is important to pay particularly close attention to the relationship of the 8EMA and the 30EMA and the 60EMA, and crossover between the current daily close price and those bands
초대 전용 스크립트
이 스크립트는 작성자가 승인한 사용자만 접근할 수 있습니다. 사용하려면 요청 후 승인을 받아야 하며, 일반적으로 결제 후에 허가가 부여됩니다. 자세한 내용은 아래 작성자의 안내를 따르거나 blockcircle에게 직접 문의하세요.
이 비공개 초대 전용 스크립트는 스크립트 모더레이터의 검토를 거치지 않았으며, 하우스 룰 준수 여부는 확인되지 않았습니다. 트레이딩뷰는 스크립트의 작동 방식을 충분히 이해하고 작성자를 완전히 신뢰하지 않는 이상, 해당 스크립트에 비용을 지불하거나 사용하는 것을 권장하지 않습니다. 커뮤니티 스크립트에서 무료 오픈소스 대안을 찾아보실 수도 있습니다.
작성자 지시 사항
Blockcircle Custom Technical Indicator Only Available to Blockcircle Members
면책사항
해당 정보와 게시물은 금융, 투자, 트레이딩 또는 기타 유형의 조언이나 권장 사항으로 간주되지 않으며, 트레이딩뷰에서 제공하거나 보증하는 것이 아닙니다. 자세한 내용은 이용 약관을 참조하세요.