OPEN-SOURCE SCRIPT
ka66: Externally-Sourced MACD
This indicator generalises the idea of MACD to take any arbitrary series available on the chart, using input.source values.
To provide an overview of the MACD indicator:
With this indicator, you can analyse momentum between any 2 series (not just EMAs), they could be raw close prices, other moving averages on the chart including specialised ones, that most MACD implementations won't provide a facility for, for example Kaufman Moving Average.
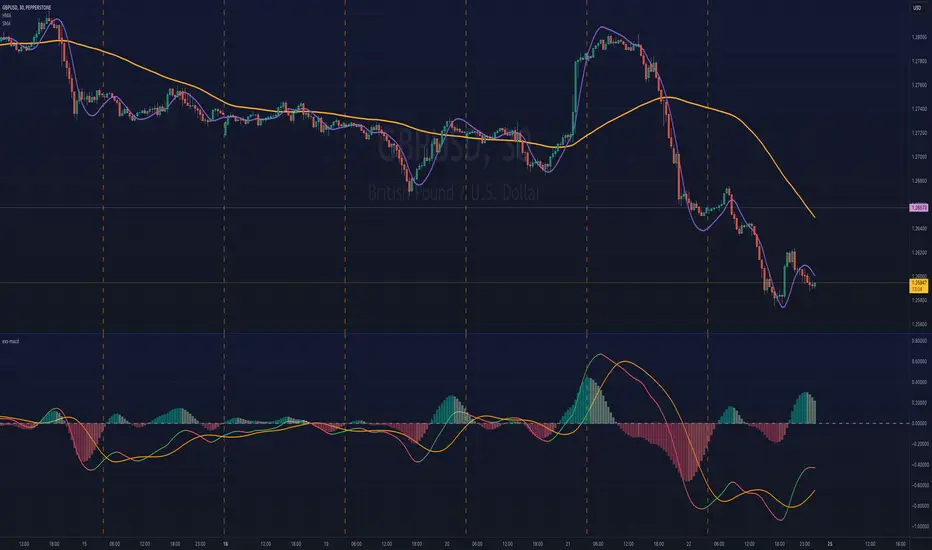
The chart shows this indicator sourcing 2 inputs from the chart:
It then calculates the MACD (Series1 - Series2), and a Signal line from the resulting MACD.
A signal series is still calculated manually by the indicator, and thus will be restricted to the provided moving average options (this indicator provides a few like EMA, SMA, Hull, and so on).
Uses of this indicator are essentially what you will use a MACD for:
To provide an overview of the MACD indicator:
- You have two EMAs, one with a faster period, usually 12, another with a slower period, usually 26.
- You calculate a MACD line, by doing (fastEMA - slowEMA)
- You then calculate a Signal Line by taking a moving average of the MACD line over some period.
With this indicator, you can analyse momentum between any 2 series (not just EMAs), they could be raw close prices, other moving averages on the chart including specialised ones, that most MACD implementations won't provide a facility for, for example Kaufman Moving Average.
The chart shows this indicator sourcing 2 inputs from the chart:
- A Hull Moving Average as the fast series
- And a Simple Moving Average as the slow series
It then calculates the MACD (Series1 - Series2), and a Signal line from the resulting MACD.
A signal series is still calculated manually by the indicator, and thus will be restricted to the provided moving average options (this indicator provides a few like EMA, SMA, Hull, and so on).
Uses of this indicator are essentially what you will use a MACD for:
- Evaluate momentum of a strength.
- Crossover Signals: MACD vs. Signal, MACD vs. Zero Line, MACD Histogram gradation.
- Evaluate overbought/oversold conditions.
- As a low-resolution view to confirm price action.
- Divergences
오픈 소스 스크립트
트레이딩뷰의 진정한 정신에 따라, 이 스크립트의 작성자는 이를 오픈소스로 공개하여 트레이더들이 기능을 검토하고 검증할 수 있도록 했습니다. 작성자에게 찬사를 보냅니다! 이 코드는 무료로 사용할 수 있지만, 코드를 재게시하는 경우 하우스 룰이 적용된다는 점을 기억하세요.
면책사항
해당 정보와 게시물은 금융, 투자, 트레이딩 또는 기타 유형의 조언이나 권장 사항으로 간주되지 않으며, 트레이딩뷰에서 제공하거나 보증하는 것이 아닙니다. 자세한 내용은 이용 약관을 참조하세요.
오픈 소스 스크립트
트레이딩뷰의 진정한 정신에 따라, 이 스크립트의 작성자는 이를 오픈소스로 공개하여 트레이더들이 기능을 검토하고 검증할 수 있도록 했습니다. 작성자에게 찬사를 보냅니다! 이 코드는 무료로 사용할 수 있지만, 코드를 재게시하는 경우 하우스 룰이 적용된다는 점을 기억하세요.
면책사항
해당 정보와 게시물은 금융, 투자, 트레이딩 또는 기타 유형의 조언이나 권장 사항으로 간주되지 않으며, 트레이딩뷰에서 제공하거나 보증하는 것이 아닙니다. 자세한 내용은 이용 약관을 참조하세요.