PROTECTED SOURCE SCRIPT
Yield Curve Analyzer - Market Radar
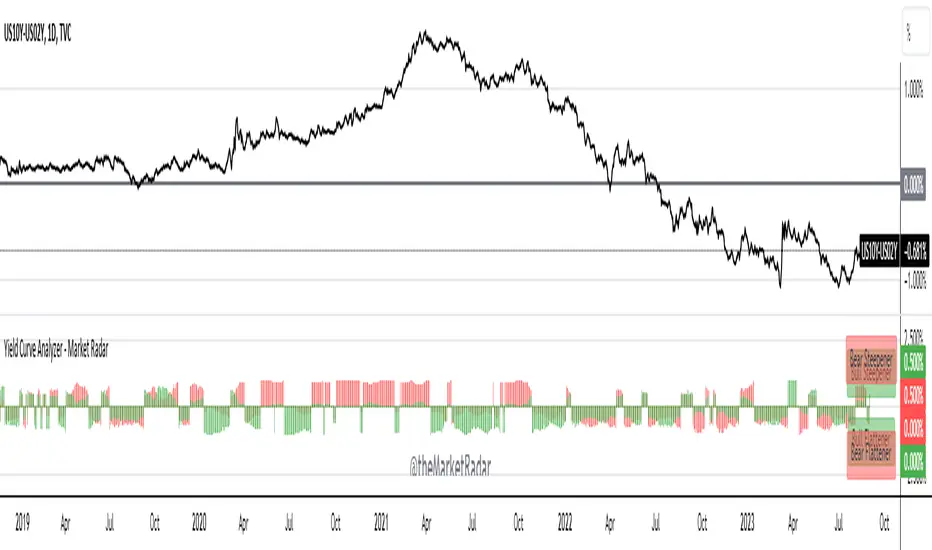
This is a script that gives insight into the types of moves that are happening across the yield curve. It helps in identifying both bull/bear steepeners and flatteners between two tenors.
The indicator displays data as a percentage of the steepeners and flatteners that have occurred over a short-term trailing window. This gives a reading that is more digestible with less noise.
Currently, the indicator only displays data for the 10Y-2Y US Treasury yield spread.
We intend to add additional spreads in the near future; such as 10Y-3M, 30Y-5Y, and 30Y-2Y.
보호된 스크립트입니다
이 스크립트는 비공개 소스로 게시됩니다. 하지만 이를 자유롭게 제한 없이 사용할 수 있습니다 – 자세한 내용은 여기에서 확인하세요.
면책사항
해당 정보와 게시물은 금융, 투자, 트레이딩 또는 기타 유형의 조언이나 권장 사항으로 간주되지 않으며, 트레이딩뷰에서 제공하거나 보증하는 것이 아닙니다. 자세한 내용은 이용 약관을 참조하세요.
보호된 스크립트입니다
이 스크립트는 비공개 소스로 게시됩니다. 하지만 이를 자유롭게 제한 없이 사용할 수 있습니다 – 자세한 내용은 여기에서 확인하세요.
면책사항
해당 정보와 게시물은 금융, 투자, 트레이딩 또는 기타 유형의 조언이나 권장 사항으로 간주되지 않으며, 트레이딩뷰에서 제공하거나 보증하는 것이 아닙니다. 자세한 내용은 이용 약관을 참조하세요.