PROTECTED SOURCE SCRIPT
업데이트됨 The Directional Cross Strategy
A simple chart-based strategy, which capitalizes on trend change.
Based on Azeez Mustapha's article featured in Stocks & Commodities Oct 2021 issue.
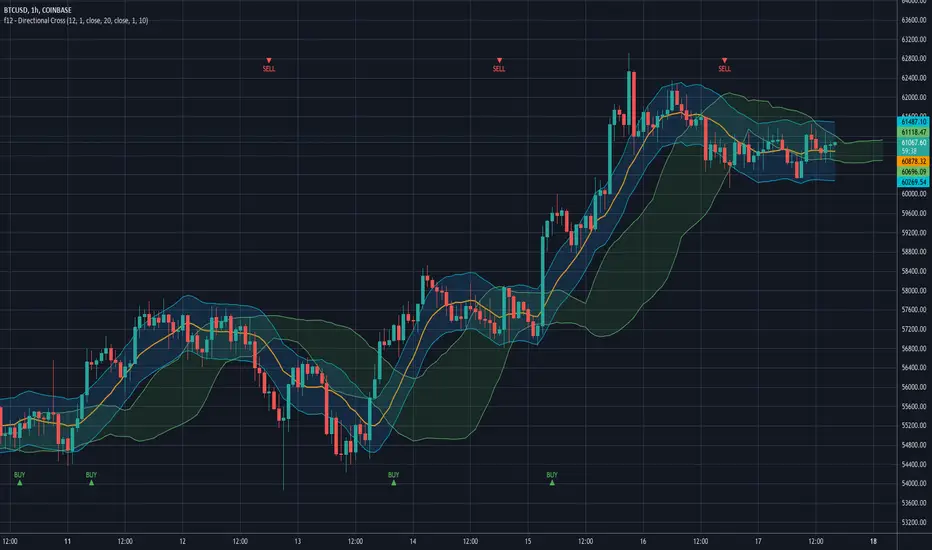
This indicator consists of three tools: a simple moving average (SMA), price envelopes, and Bollinger Bands.
Please note that this strategy only works in trending markets.
What is a trending market?
A trending market is one that is ascending with higher highs and higher lows or descending with lower highs and lower lows.
So, when the market is ranging it's not a good fit for this strategy. It is therefore advisable for the trader to stay out of the market when consolidation is noticed.
Usage of other tools in combination with this one is recommended to determine the market conditions.
Ok, so how to use this indicator:
The combination of the indicators used in this strategy displays BUY and SELL alerts.
When the lower line of the envelope on the chart would cross over the lower band of the Bollinger Bands, a BUY alert is displayed.
When the upper line of the envelope on the chart would cross down the upper band of the Bollinger Bands, a SELL alert is displayed.
As always, proper risk management should be followed.
Based on Azeez Mustapha's article featured in Stocks & Commodities Oct 2021 issue.
This indicator consists of three tools: a simple moving average (SMA), price envelopes, and Bollinger Bands.
Please note that this strategy only works in trending markets.
What is a trending market?
A trending market is one that is ascending with higher highs and higher lows or descending with lower highs and lower lows.
So, when the market is ranging it's not a good fit for this strategy. It is therefore advisable for the trader to stay out of the market when consolidation is noticed.
Usage of other tools in combination with this one is recommended to determine the market conditions.
Ok, so how to use this indicator:
The combination of the indicators used in this strategy displays BUY and SELL alerts.
When the lower line of the envelope on the chart would cross over the lower band of the Bollinger Bands, a BUY alert is displayed.
When the upper line of the envelope on the chart would cross down the upper band of the Bollinger Bands, a SELL alert is displayed.
As always, proper risk management should be followed.
릴리즈 노트
Buy/Sell signals now coordinate with the BB offset.보호된 스크립트입니다
이 스크립트는 비공개 소스로 게시됩니다. 하지만 이를 자유롭게 제한 없이 사용할 수 있습니다 – 자세한 내용은 여기에서 확인하세요.
면책사항
해당 정보와 게시물은 금융, 투자, 트레이딩 또는 기타 유형의 조언이나 권장 사항으로 간주되지 않으며, 트레이딩뷰에서 제공하거나 보증하는 것이 아닙니다. 자세한 내용은 이용 약관을 참조하세요.
면책사항
해당 정보와 게시물은 금융, 투자, 트레이딩 또는 기타 유형의 조언이나 권장 사항으로 간주되지 않으며, 트레이딩뷰에서 제공하거나 보증하는 것이 아닙니다. 자세한 내용은 이용 약관을 참조하세요.