OPEN-SOURCE SCRIPT
업데이트됨 William Blau Ergodic Tick Volume Indicator (TVI) [Loxx]
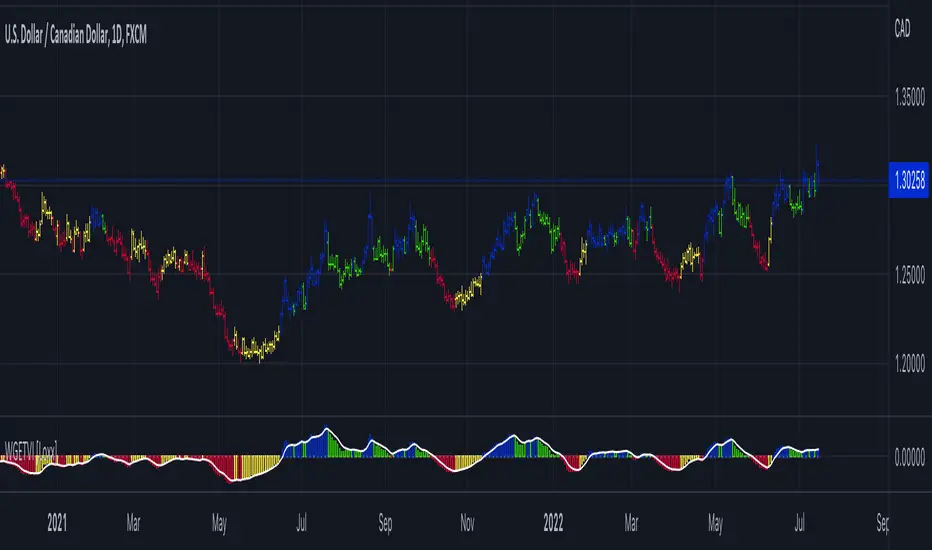
William Blau Ergodic Tick Volume Indicator (TVI) [Loxx] is a volume/volatility indicator that is used for finding reversals in price movement
What is William Blau Ergodic Tick Volume?
This is one of the techniques described by William Blau in his book "Momentum, Direction and Divergence" (1995). If you like to learn more, we advise you to read this book. His book focuses on three key aspects of trading: momentum, direction and divergence. Blau, who was an electrical engineer before becoming a trader, thoroughly examines the relationship between price and momentum in step-by-step examples. From this grounding, he then looks at the deficiencies in other oscillators and introduces some innovative techniques, including a fresh twist on Stochastics. On directional issues, he analyzes the intricacies of ADX and offers a unique approach to help define trending and non-trending periods.
William Blau's definition of TVI ergodicity is that the indictor is ergodic when periods are set to 32, 5, 1, and the signal is set to 5. Other combinations are not ergodic, according to Blau.
How to use TVI
Included
What is William Blau Ergodic Tick Volume?
This is one of the techniques described by William Blau in his book "Momentum, Direction and Divergence" (1995). If you like to learn more, we advise you to read this book. His book focuses on three key aspects of trading: momentum, direction and divergence. Blau, who was an electrical engineer before becoming a trader, thoroughly examines the relationship between price and momentum in step-by-step examples. From this grounding, he then looks at the deficiencies in other oscillators and introduces some innovative techniques, including a fresh twist on Stochastics. On directional issues, he analyzes the intricacies of ADX and offers a unique approach to help define trending and non-trending periods.
William Blau's definition of TVI ergodicity is that the indictor is ergodic when periods are set to 32, 5, 1, and the signal is set to 5. Other combinations are not ergodic, according to Blau.
How to use TVI
- TVI bar color change is a signal to enter the market. When the TVI changes from yellow to red, it is a signal to buy and if the TVI bar changes from blue to green, it is a signal to sell.
- Just like the MACD and TRIX, the zero line on the indicator determines market sentiment and trend. If the TVI bars are above the zero line it's bullish and if the TVI bars are below the zero line the trend is bearish. Zero line crosses can be used to determine continuation and trend entries as well.
Included
- Bar coloring
- 35+ moving averages for both TVI and the signal
릴리즈 노트
Updated input titles. 릴리즈 노트
UPDATED buy signal to: When the TVI changes from RED to YELLOW, it is a signal to buy 오픈 소스 스크립트
트레이딩뷰의 진정한 정신에 따라, 이 스크립트의 작성자는 이를 오픈소스로 공개하여 트레이더들이 기능을 검토하고 검증할 수 있도록 했습니다. 작성자에게 찬사를 보냅니다! 이 코드는 무료로 사용할 수 있지만, 코드를 재게시하는 경우 하우스 룰이 적용된다는 점을 기억하세요.
Public Telegram Group, t.me/algxtrading_public
VIP Membership Info: patreon.com/algxtrading/membership
VIP Membership Info: patreon.com/algxtrading/membership
면책사항
해당 정보와 게시물은 금융, 투자, 트레이딩 또는 기타 유형의 조언이나 권장 사항으로 간주되지 않으며, 트레이딩뷰에서 제공하거나 보증하는 것이 아닙니다. 자세한 내용은 이용 약관을 참조하세요.
오픈 소스 스크립트
트레이딩뷰의 진정한 정신에 따라, 이 스크립트의 작성자는 이를 오픈소스로 공개하여 트레이더들이 기능을 검토하고 검증할 수 있도록 했습니다. 작성자에게 찬사를 보냅니다! 이 코드는 무료로 사용할 수 있지만, 코드를 재게시하는 경우 하우스 룰이 적용된다는 점을 기억하세요.
Public Telegram Group, t.me/algxtrading_public
VIP Membership Info: patreon.com/algxtrading/membership
VIP Membership Info: patreon.com/algxtrading/membership
면책사항
해당 정보와 게시물은 금융, 투자, 트레이딩 또는 기타 유형의 조언이나 권장 사항으로 간주되지 않으며, 트레이딩뷰에서 제공하거나 보증하는 것이 아닙니다. 자세한 내용은 이용 약관을 참조하세요.