PROTECTED SOURCE SCRIPT
업데이트됨 Price-Mapped Multi-Cycle Sine Waves
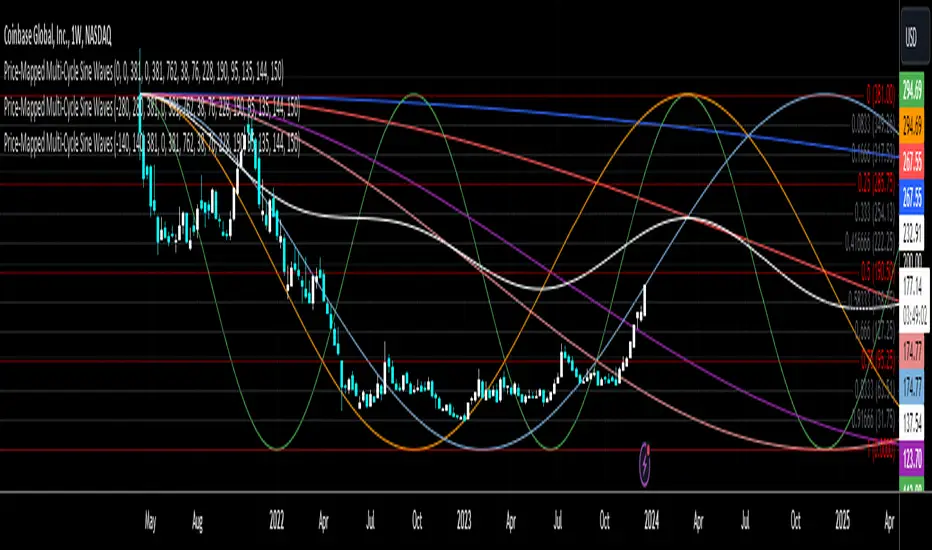
The primary function is to overlay a series of sine wave patterns onto a chart, providing a nuanced and visually intuitive representation of market dynamics.
Key features of this script include:
User-Defined Parameters: It allows users to input various parameters such as start bar (of the sine wave, so that we can start at a dynamic point), start date of the cycle plots, price range, and cycle lengths. These parameters enable customization of the sine wave patterns according to the user's specific analytical needs.
Multiple Sine Wave Cycles: It can generate up to ten different sine wave cycles, each with its own length and activation toggle.
Dynamic Visualization: The script plots these sine waves on the TradingView chart, each with a distinct color and the ability to offset the waves based on user input. This visual differentiation aids in easy identification and comparison of the different cycles.
Average Wave Calculation: Additionally, the script calculates an average wave based on the enabled cycles, providing a consolidated view of the market movement trends.
In essence, this script is a versatile tool for technical analysts and traders, offering a unique way to visualize and analyze market cycles and trends through the lens of sine wave theory. It stands as a testament to the confluence of mathematical elegance and practical financial analysis.
릴리즈 노트
An update to the image that was shared on this landing page보호된 스크립트입니다
이 스크립트는 비공개 소스로 게시됩니다. 하지만 이를 자유롭게 제한 없이 사용할 수 있습니다 – 자세한 내용은 여기에서 확인하세요.
면책사항
해당 정보와 게시물은 금융, 투자, 트레이딩 또는 기타 유형의 조언이나 권장 사항으로 간주되지 않으며, 트레이딩뷰에서 제공하거나 보증하는 것이 아닙니다. 자세한 내용은 이용 약관을 참조하세요.
보호된 스크립트입니다
이 스크립트는 비공개 소스로 게시됩니다. 하지만 이를 자유롭게 제한 없이 사용할 수 있습니다 – 자세한 내용은 여기에서 확인하세요.
면책사항
해당 정보와 게시물은 금융, 투자, 트레이딩 또는 기타 유형의 조언이나 권장 사항으로 간주되지 않으며, 트레이딩뷰에서 제공하거나 보증하는 것이 아닙니다. 자세한 내용은 이용 약관을 참조하세요.