OPEN-SOURCE SCRIPT
Strong Support and Resistance with EMAs @viniciushadek
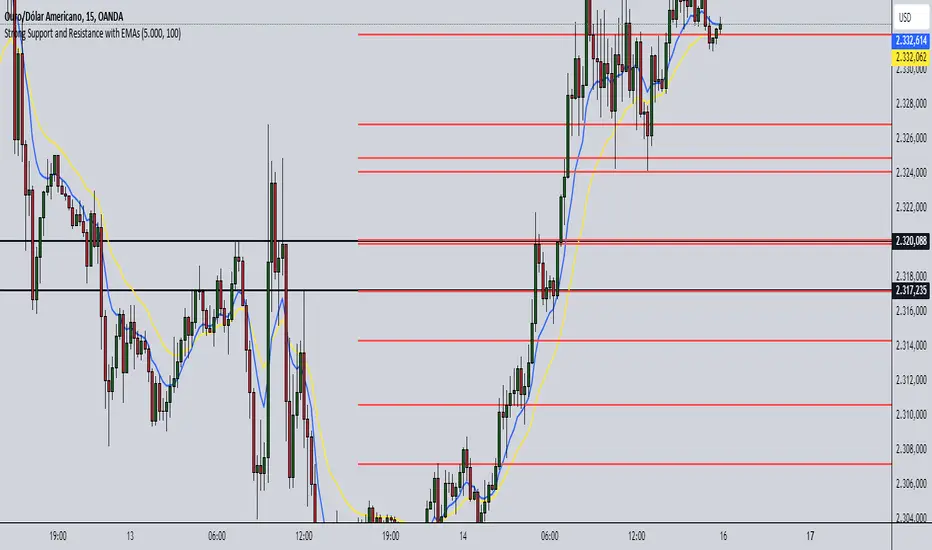
This strategy involves using two exponential moving averages (EMA) - one with a 20-period and another with a 9-period - along with identifying support and resistance levels on the chart. Combining these tools can help determine trend continuation points and potential entry and exit points in market operations.
### 1. Setting Up the Exponential Moving Averages
- **20-Period EMA**: This moving average provides a medium-term trend view. It helps smooth out price fluctuations and identify the overall market direction.
- **9-Period EMA**: This moving average is more sensitive and reacts more quickly to price changes, providing short-term signals.
### 2. Identifying Support and Resistance
- **Support**: Price levels where demand is strong enough to prevent the price from falling further. These levels are identified based on previous lows.
- **Resistance**: Price levels where supply is strong enough to prevent the price from rising further. These levels are identified based on previous highs.
### 3. Continuity Points
The strategy focuses on identifying trend continuation points using the interaction between the EMAs and the support and resistance levels.
### 4. Buy Signals
- When the 9-period EMA crosses above the 20-period EMA.
- Confirm the entry if the price is near a support level or breaking through a resistance level.
### 5. Sell Signals
- When the 9-period EMA crosses below the 20-period EMA.
- Confirm the exit if the price is near a resistance level or breaking through a support level.
### 6. Risk Management
- Use appropriate stops below identified supports for buy operations.
- Use appropriate stops above identified resistances for sell operations.
### 7. Validating the Trend
- Check if the trend is validated by other technical indicators, such as the Relative Strength Index (RSI) or Volume.
### Conclusion
This strategy uses the combination of exponential moving averages and support and resistance levels to identify continuity points in the market trend. It is crucial to confirm the signals with other technical analysis tools and maintain proper risk management to maximize results and minimize losses.
Implementing this approach can provide a clearer view of market movements and help make more informed trading decisions.
오픈 소스 스크립트
트레이딩뷰의 진정한 정신에 따라, 이 스크립트의 작성자는 이를 오픈소스로 공개하여 트레이더들이 기능을 검토하고 검증할 수 있도록 했습니다. 작성자에게 찬사를 보냅니다! 이 코드는 무료로 사용할 수 있지만, 코드를 재게시하는 경우 하우스 룰이 적용된다는 점을 기억하세요.
면책사항
해당 정보와 게시물은 금융, 투자, 트레이딩 또는 기타 유형의 조언이나 권장 사항으로 간주되지 않으며, 트레이딩뷰에서 제공하거나 보증하는 것이 아닙니다. 자세한 내용은 이용 약관을 참조하세요.
오픈 소스 스크립트
트레이딩뷰의 진정한 정신에 따라, 이 스크립트의 작성자는 이를 오픈소스로 공개하여 트레이더들이 기능을 검토하고 검증할 수 있도록 했습니다. 작성자에게 찬사를 보냅니다! 이 코드는 무료로 사용할 수 있지만, 코드를 재게시하는 경우 하우스 룰이 적용된다는 점을 기억하세요.
면책사항
해당 정보와 게시물은 금융, 투자, 트레이딩 또는 기타 유형의 조언이나 권장 사항으로 간주되지 않으며, 트레이딩뷰에서 제공하거나 보증하는 것이 아닙니다. 자세한 내용은 이용 약관을 참조하세요.