OPEN-SOURCE SCRIPT
업데이트됨 Entry-Exit point
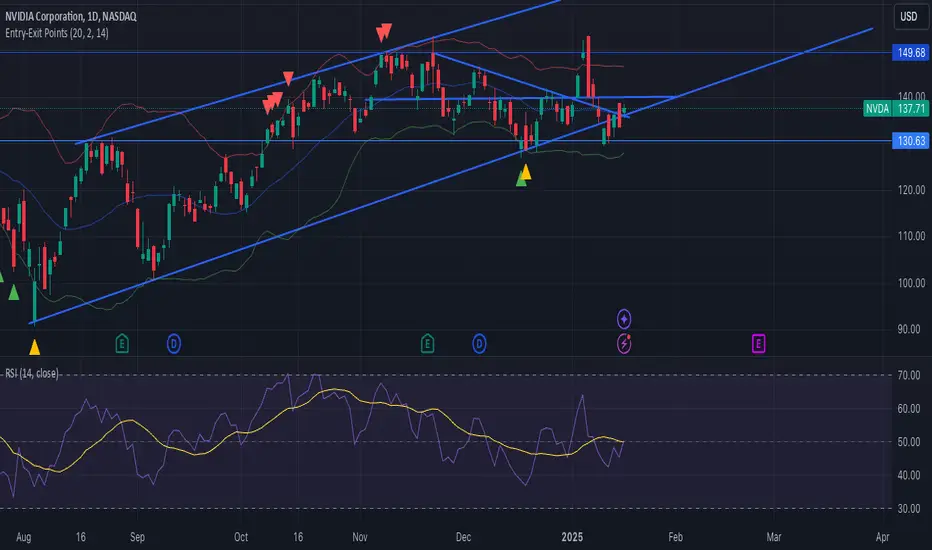
This indicator combines Bollinger Bands and RSI (Relative Strength Index) to generate entry and exit signals based on price movements and trend conditions.
### Key Features:
- **Bollinger Bands**: The indicator uses Bollinger Bands to assess volatility, with the upper and lower bands plotted around a simple moving average (SMA) of the price. The bands expand and contract based on the standard deviation, providing insights into potential overbought or oversold conditions.
- **RSI**: The RSI is used to determine if the price is overbought or oversold. In this case, it highlights conditions when the RSI is below 40 (oversold) for bullish signals and above 65 (overbought) for bearish signals.
- **Trend Analysis**: The indicator analyzes the previous high and low values to determine the market trend. It identifies uptrend and downtrend conditions based on recent price action.
- **Entry Signals**:
- **Bullish Entry (Green Arrows)**: A signal is generated when the price touches or dips below the lower Bollinger Band, the RSI is under 40, and the current candle shows a downtrend (lower high and low).
- **Bearish Entry (Red Arrows)**: A signal is triggered when the price touches or rises above the upper Bollinger Band, the RSI is above 65, and the current candle shows an uptrend (higher high and low).
### Visuals:
- **Green Up Arrows**: Indicate a potential bullish entry point, plotted below the bar.
- **Red Down Arrows**: Indicate a potential bearish entry point, plotted above the bar.
- **Bollinger Bands**: The upper and lower bands are shown in red and green, with the basis (SMA) in blue.
This indicator provides a clear, rule-based system for detecting potential price reversals based on both volatility (Bollinger Bands) and momentum (RSI), making it useful for traders looking to enter positions during strong trend reversals.
by Frank R.
Abraço primo Lucas Rodrigues
릴리즈 노트
This indicator combines Bollinger Bands and RSI (Relative Strength Index) to generate entry and exit signals based on price movements and trend conditions. ### Key Features:
- **Bollinger Bands**: The indicator uses Bollinger Bands to assess volatility, with the upper and lower bands plotted around a simple moving average (SMA) of the price. The bands expand and contract based on the standard deviation, providing insights into potential overbought or oversold conditions.
- **RSI**: The RSI is used to determine if the price is overbought or oversold. In this case, it highlights conditions when the RSI is below 40 (oversold) for bullish signals and above 65 (overbought) for bearish signals.
- **Trend Analysis**: The indicator analyzes the previous high and low values to determine the market trend. It identifies uptrend and downtrend conditions based on recent price action.
- **Entry Signals**:
- **Bullish Entry (Green Arrows)**: A signal is generated when the price touches or dips below the lower Bollinger Band, the RSI is under 40, and the current candle shows a downtrend (lower high and low).
- **Bearish Entry (Red Arrows)**: A signal is triggered when the price touches or rises above the upper Bollinger Band, the RSI is above 65, and the current candle shows an uptrend (higher high and low).
### Visuals:
- **Green Up Arrows**: Indicate a potential bullish entry point, plotted below the bar.
- **Red Down Arrows**: Indicate a potential bearish entry point, plotted above the bar.
- **Bollinger Bands**: The upper and lower bands are shown in red and green, with the basis (SMA) in blue.
This indicator provides a clear, rule-based system for detecting potential price reversals based on both volatility (Bollinger Bands) and momentum (RSI), making it useful for traders looking to enter positions during strong trend reversals.
릴리즈 노트
This indicator combines Bollinger Bands and RSI (Relative Strength Index) to provide entry and exit signals based on price movements and market trends.Key Features:
Bollinger Bands: The indicator uses Bollinger Bands with a period of 20 and a multiplier of 2. The upper and lower bands are plotted around a simple moving average (SMA) of the price. These bands help to assess volatility and potential overbought or oversold conditions.
RSI (Relative Strength Index): The RSI is used to measure the strength of a price move. Values below 40 suggest oversold conditions, while values above 65 indicate overbought conditions.
Trend Identification: The script determines the trend direction by analyzing previous price highs and lows. An uptrend is indicated when the current candle has higher highs and higher lows, while a downtrend is shown by lower highs and lower lows.
Entry Conditions:
Bullish Entry (Green Arrows): A bullish entry signal is generated when:
The price touches or falls below the lower Bollinger Band.
The RSI is below 40 (indicating oversold conditions).
The current candle shows a downtrend (lower high and lower low).
Bearish Entry (Red Arrows): A bearish entry signal is generated when:
The price touches or rises above the upper Bollinger Band.
The RSI is above 65 (indicating overbought conditions).
The current candle shows an uptrend (higher high and higher low).
Visuals:
Green Up Arrows: Indicate a potential bullish entry point, plotted below the price bar.
Red Down Arrows: Indicate a potential bearish entry point, plotted above the price bar.
Bollinger Bands: The upper and lower bands are plotted in red and green, with the basis (SMA) shown in blue.
This indicator is designed to help traders identify potential reversal points by combining the insights from Bollinger Bands and RSI, making it a useful tool for capturing trend reversals and making timely trading decisions.
릴리즈 노트
adding gold exit and entry points, depending on vix valuesGold Entry: VIX > 20
Gold Exit: VIX < 13
오픈 소스 스크립트
트레이딩뷰의 진정한 정신에 따라, 이 스크립트의 작성자는 이를 오픈소스로 공개하여 트레이더들이 기능을 검토하고 검증할 수 있도록 했습니다. 작성자에게 찬사를 보냅니다! 이 코드는 무료로 사용할 수 있지만, 코드를 재게시하는 경우 하우스 룰이 적용된다는 점을 기억하세요.
면책사항
해당 정보와 게시물은 금융, 투자, 트레이딩 또는 기타 유형의 조언이나 권장 사항으로 간주되지 않으며, 트레이딩뷰에서 제공하거나 보증하는 것이 아닙니다. 자세한 내용은 이용 약관을 참조하세요.
오픈 소스 스크립트
트레이딩뷰의 진정한 정신에 따라, 이 스크립트의 작성자는 이를 오픈소스로 공개하여 트레이더들이 기능을 검토하고 검증할 수 있도록 했습니다. 작성자에게 찬사를 보냅니다! 이 코드는 무료로 사용할 수 있지만, 코드를 재게시하는 경우 하우스 룰이 적용된다는 점을 기억하세요.
면책사항
해당 정보와 게시물은 금융, 투자, 트레이딩 또는 기타 유형의 조언이나 권장 사항으로 간주되지 않으며, 트레이딩뷰에서 제공하거나 보증하는 것이 아닙니다. 자세한 내용은 이용 약관을 참조하세요.