OPEN-SOURCE SCRIPT
VWAP - Trend
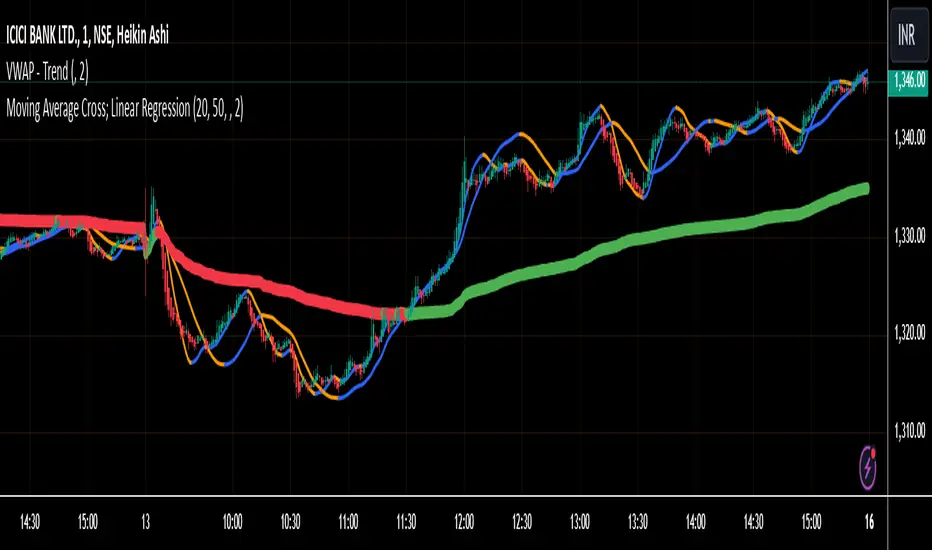
This Pine Script calculates the Volume Weighted Average Price (VWAP) for a specified timeframe and plots its Linear Regression over a user-defined lookback period. The regression line is color-coded: green indicates an uptrend and red indicates a downtrend. The line is broken at the end of each day to prevent it from extending into the next day, ensuring clarity on a daily basis.
Key Features:
VWAP Calculation: The VWAP is calculated based on a selected timeframe, providing a smoothed average price considering volume.
Linear Regression: The script calculates a linear regression of the VWAP over a custom lookback period to capture the underlying trend.
Color-Coding: The regression line is color-coded to easily identify trends—green for an uptrend and red for a downtrend.
Day-End Break: The regression line breaks at the end of each day to prevent continuous plotting across days, which helps keep the analysis focused within daily intervals.
User Inputs: The user can adjust the VWAP timeframe and the linear regression lookback period to tailor the indicator to their preferences.
This script provides a visual representation of the VWAP trend, helping traders identify potential market directions and turning points based on the linear regression of the VWAP.
오픈 소스 스크립트
트레이딩뷰의 진정한 정신에 따라, 이 스크립트의 작성자는 이를 오픈소스로 공개하여 트레이더들이 기능을 검토하고 검증할 수 있도록 했습니다. 작성자에게 찬사를 보냅니다! 이 코드는 무료로 사용할 수 있지만, 코드를 재게시하는 경우 하우스 룰이 적용된다는 점을 기억하세요.
면책사항
해당 정보와 게시물은 금융, 투자, 트레이딩 또는 기타 유형의 조언이나 권장 사항으로 간주되지 않으며, 트레이딩뷰에서 제공하거나 보증하는 것이 아닙니다. 자세한 내용은 이용 약관을 참조하세요.
오픈 소스 스크립트
트레이딩뷰의 진정한 정신에 따라, 이 스크립트의 작성자는 이를 오픈소스로 공개하여 트레이더들이 기능을 검토하고 검증할 수 있도록 했습니다. 작성자에게 찬사를 보냅니다! 이 코드는 무료로 사용할 수 있지만, 코드를 재게시하는 경우 하우스 룰이 적용된다는 점을 기억하세요.
면책사항
해당 정보와 게시물은 금융, 투자, 트레이딩 또는 기타 유형의 조언이나 권장 사항으로 간주되지 않으며, 트레이딩뷰에서 제공하거나 보증하는 것이 아닙니다. 자세한 내용은 이용 약관을 참조하세요.