OPEN-SOURCE SCRIPT
업데이트됨 VWMA True Range | Lyro RS
VWMA True Range | Lyro RS
This script is a hybrid technical analysis tool designed to identify trends and spot potential reversals. It employs a consensus-based system that uses multiple smoothed, Volume-Weighted Moving Averages (VWMA) to generate both trend-following and counter-trend signals.
Understanding the Indicator's Components
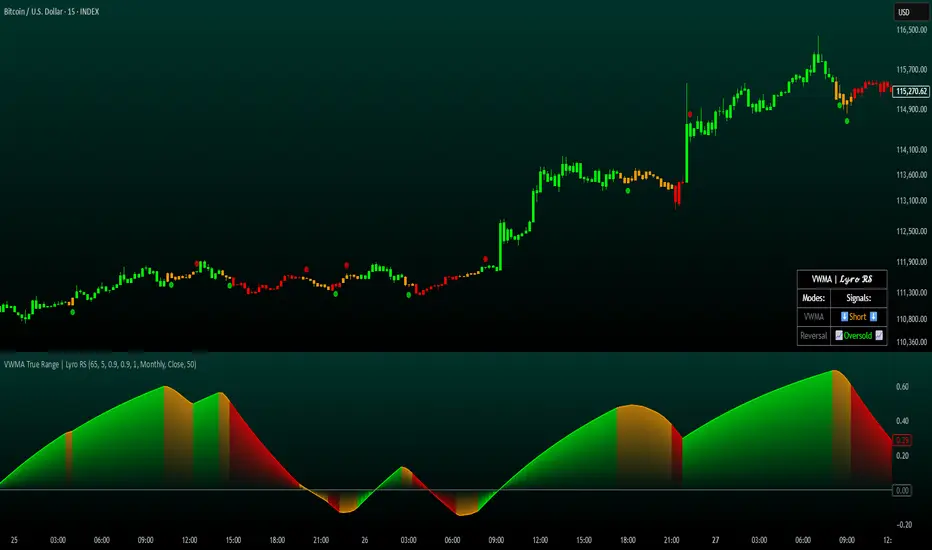
The indicator plots a main line on a separate pane and provides visual alerts directly on the chart.
The Main Line: This line represents a smoothed average of momentum scores derived from multiple VWMAs. Its direction and value are the foundation of the analysis.

Signal Generation: The tool provides two distinct types of signals:
Trend Signals: These trend-following signals ("⬆️Long" / "⬇️Short") activate when the indicator's consensus reaches a pre-set strength threshold, indicating sustained momentum in one direction.
Reversal Signals: These counter-trend alerts ("📈Oversold" / "📉Overbought") trigger when the main line breaks a previous period's level, hinting at exhaustion and a potential short-term reversal.

Visual Alerts:
Colored Background: The indicator's background highlights during strong trend signals for added visual emphasis.
Chart Shapes: Small circles appear on the main chart to mark where potential reversals are detected.
Colored Candles: You can choose to color the price candles to reflect the current trend signal.
Information Table: A compact table provides an at-a-glance summary of all currently active signals.

Suggested Use and Interpretation
Here are a few ways to incorporate this indicator into your analysis:
Following the Trend: Use the "Long" or "Short" trend signals to align your trades with the prevailing market momentum.
Spotting Reversals: Watch for "Oversold" or "Overbought" reversal signals, often accompanied by chart shapes, to identify potential market turning points.
Combining Signals: Use the primary trend signal for context and look for reversal signals that may indicate a pullback within the larger trend, potentially offering favorable entry points.
Customization Options:
You can tailor the indicator's behavior and appearance through several settings:
Core Settings: Adjust the Calculation Period and Smooth Length to make the main line more or less responsive to price movements.
Signal Thresholds: Fine-tune the Long threshold and Short threshold to control how easily trend signals are triggered.
Visual Settings: Toggle various visual elements like the indicator band, candle coloring, and the information table on or off.
Table Settings: Customize where the information table appears and its size to suit your chart layout.
⚠️Disclaimer
This indicator is a tool for technical analysis and does not guarantee future results. It should be used as part of a comprehensive trading strategy that includes other analysis techniques and strict risk management. The creators are not responsible for any financial decisions made based on its signals.
This script is a hybrid technical analysis tool designed to identify trends and spot potential reversals. It employs a consensus-based system that uses multiple smoothed, Volume-Weighted Moving Averages (VWMA) to generate both trend-following and counter-trend signals.
Understanding the Indicator's Components
The indicator plots a main line on a separate pane and provides visual alerts directly on the chart.
The Main Line: This line represents a smoothed average of momentum scores derived from multiple VWMAs. Its direction and value are the foundation of the analysis.
Signal Generation: The tool provides two distinct types of signals:
Trend Signals: These trend-following signals ("⬆️Long" / "⬇️Short") activate when the indicator's consensus reaches a pre-set strength threshold, indicating sustained momentum in one direction.
Reversal Signals: These counter-trend alerts ("📈Oversold" / "📉Overbought") trigger when the main line breaks a previous period's level, hinting at exhaustion and a potential short-term reversal.
Visual Alerts:
Colored Background: The indicator's background highlights during strong trend signals for added visual emphasis.
Chart Shapes: Small circles appear on the main chart to mark where potential reversals are detected.
Colored Candles: You can choose to color the price candles to reflect the current trend signal.
Information Table: A compact table provides an at-a-glance summary of all currently active signals.
Suggested Use and Interpretation
Here are a few ways to incorporate this indicator into your analysis:
Following the Trend: Use the "Long" or "Short" trend signals to align your trades with the prevailing market momentum.
Spotting Reversals: Watch for "Oversold" or "Overbought" reversal signals, often accompanied by chart shapes, to identify potential market turning points.
Combining Signals: Use the primary trend signal for context and look for reversal signals that may indicate a pullback within the larger trend, potentially offering favorable entry points.
Customization Options:
You can tailor the indicator's behavior and appearance through several settings:
Core Settings: Adjust the Calculation Period and Smooth Length to make the main line more or less responsive to price movements.
Signal Thresholds: Fine-tune the Long threshold and Short threshold to control how easily trend signals are triggered.
Visual Settings: Toggle various visual elements like the indicator band, candle coloring, and the information table on or off.
Table Settings: Customize where the information table appears and its size to suit your chart layout.
⚠️Disclaimer
This indicator is a tool for technical analysis and does not guarantee future results. It should be used as part of a comprehensive trading strategy that includes other analysis techniques and strict risk management. The creators are not responsible for any financial decisions made based on its signals.
릴리즈 노트
Update: Added design, fixed table.오픈 소스 스크립트
트레이딩뷰의 진정한 정신에 따라, 이 스크립트의 작성자는 이를 오픈소스로 공개하여 트레이더들이 기능을 검토하고 검증할 수 있도록 했습니다. 작성자에게 찬사를 보냅니다! 이 코드는 무료로 사용할 수 있지만, 코드를 재게시하는 경우 하우스 룰이 적용된다는 점을 기억하세요.
Get access to our private indicators & analysis: whop.com/lyro-rs
Join our community: discord.gg/kcEBMWaFjS
All material from Lyro RS is for educational purposes only. Past performance does not guarantee future results.
Join our community: discord.gg/kcEBMWaFjS
All material from Lyro RS is for educational purposes only. Past performance does not guarantee future results.
면책사항
해당 정보와 게시물은 금융, 투자, 트레이딩 또는 기타 유형의 조언이나 권장 사항으로 간주되지 않으며, 트레이딩뷰에서 제공하거나 보증하는 것이 아닙니다. 자세한 내용은 이용 약관을 참조하세요.
오픈 소스 스크립트
트레이딩뷰의 진정한 정신에 따라, 이 스크립트의 작성자는 이를 오픈소스로 공개하여 트레이더들이 기능을 검토하고 검증할 수 있도록 했습니다. 작성자에게 찬사를 보냅니다! 이 코드는 무료로 사용할 수 있지만, 코드를 재게시하는 경우 하우스 룰이 적용된다는 점을 기억하세요.
Get access to our private indicators & analysis: whop.com/lyro-rs
Join our community: discord.gg/kcEBMWaFjS
All material from Lyro RS is for educational purposes only. Past performance does not guarantee future results.
Join our community: discord.gg/kcEBMWaFjS
All material from Lyro RS is for educational purposes only. Past performance does not guarantee future results.
면책사항
해당 정보와 게시물은 금융, 투자, 트레이딩 또는 기타 유형의 조언이나 권장 사항으로 간주되지 않으며, 트레이딩뷰에서 제공하거나 보증하는 것이 아닙니다. 자세한 내용은 이용 약관을 참조하세요.