OPEN-SOURCE SCRIPT
RVSI & MACD Confluence Background
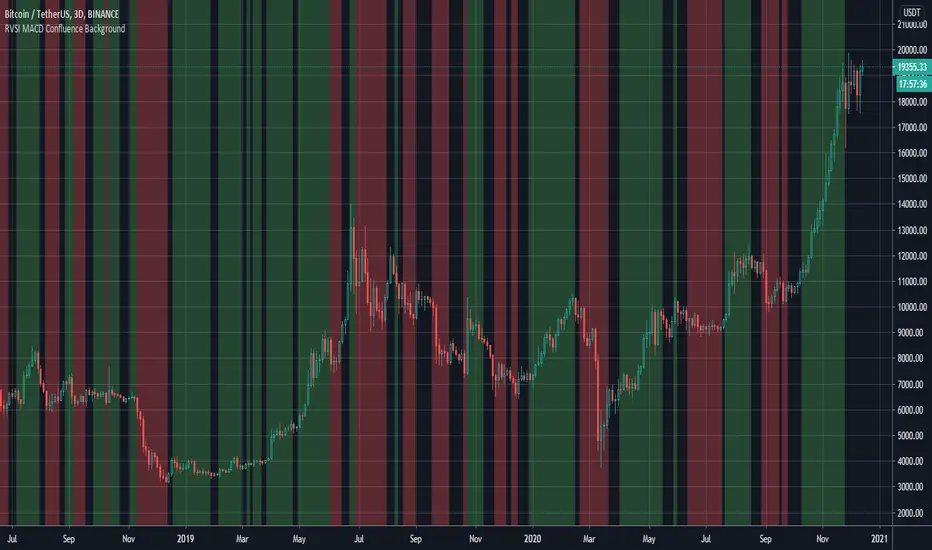
This indicator colors the background in vertical (green/red) stripes to indicate if the current trend is possibly bull / bear
A region where the background is not colored indicates that the present trend can not be identified
The algo combines the RVSI (Relative Volume Strength Index {ref fract} ) and the MACD
The Relative Volume Strength Index has been adapted to include 2 moving averages, one fast and one slow
This same fast slow lookback length is applied to the MACD for simplicity
What's interesting is that there is a very strong confluence between the MACD and RVSI, as the MACD is obtained from 'price action only' and the RVSI from the 'volume only'
So a break in confluence of these two might suggest that the current trend is weakening in confidence or can not be clearly identified
Generally, a green background means consider going long ie price trend is rising
A red background means consider going short ie price trend is falling
An absent background color means - consider exiting current trade or wait to get into a new trade
Best Regards, MoonFlag - and a special thanks/mention to 'fract' for the RVSI algo this is derived from
오픈 소스 스크립트
트레이딩뷰의 진정한 정신에 따라, 이 스크립트의 작성자는 이를 오픈소스로 공개하여 트레이더들이 기능을 검토하고 검증할 수 있도록 했습니다. 작성자에게 찬사를 보냅니다! 이 코드는 무료로 사용할 수 있지만, 코드를 재게시하는 경우 하우스 룰이 적용된다는 점을 기억하세요.
면책사항
해당 정보와 게시물은 금융, 투자, 트레이딩 또는 기타 유형의 조언이나 권장 사항으로 간주되지 않으며, 트레이딩뷰에서 제공하거나 보증하는 것이 아닙니다. 자세한 내용은 이용 약관을 참조하세요.
오픈 소스 스크립트
트레이딩뷰의 진정한 정신에 따라, 이 스크립트의 작성자는 이를 오픈소스로 공개하여 트레이더들이 기능을 검토하고 검증할 수 있도록 했습니다. 작성자에게 찬사를 보냅니다! 이 코드는 무료로 사용할 수 있지만, 코드를 재게시하는 경우 하우스 룰이 적용된다는 점을 기억하세요.
면책사항
해당 정보와 게시물은 금융, 투자, 트레이딩 또는 기타 유형의 조언이나 권장 사항으로 간주되지 않으며, 트레이딩뷰에서 제공하거나 보증하는 것이 아닙니다. 자세한 내용은 이용 약관을 참조하세요.