OPEN-SOURCE SCRIPT
Renko Dots [racer8]
Description:
The idea behind this indicator is to have the Renko chart alongside with your main chart. What this indicator does is that it plots the values from the Renko Chart directly onto your main chart. So, you don't have to switch between Renko and OHLC charts anymore!
Parameters:
Renko Dots has to 2 parameters: Method & Length.
Method can be either Traditional or ATR. These are 2 different styles of Renko. Personally, I prefer ATR.
Length controls traditional Renko bar's fixed price range or controls the ATR period.
Signal Interpretation:
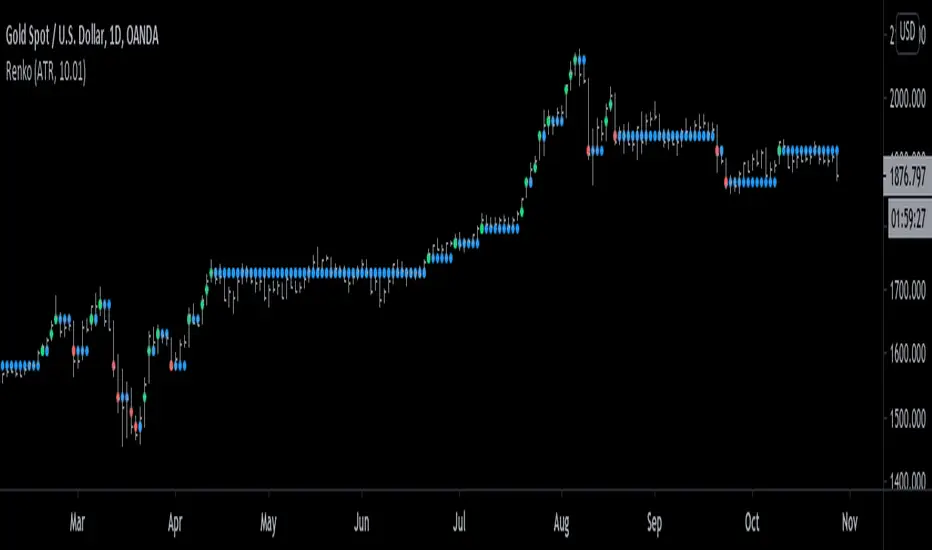
These Renko values are plotted as "Renko Dots" on your chart. The dots can be either green, red, or blue depending on market movements.
Green - new Renko bar (bullish)
Red - new Renko bar (bearish)
Blue - no new Renko bar (consolidation)
What is a Renko chart?
A Renko chart is a special chart that modifies a regular price chart's information about the close price and transforms it into Renko values that are plotted as Renko boxes on a chart. These boxes typically have a fixed range, say 10 pips for example. So if price moves at least 10 pips, a box is formed. Alternatively, the box's range can be set to the ATR....so in this case, each box represents a move of 1 ATR.
For more information on Renko charts, visit Investopedia.com, here's the link: investopedia.com/terms/r/renkochart.asp
Renko Dots' advantages over standard Renko chart:
- Can compare & apply it to other price charts (ohlc, candlesticks, line charts)
- Can apply it to other modified price charts (Heikin-Ashi, Renko, Line-Break)
- Can use it to trade alongside with the main chart
- Works across all instruments/markets and all time frames
- Plots consolidation (blue dots) ... (standard Renko doesn't consider time)
Enjoy :)
The idea behind this indicator is to have the Renko chart alongside with your main chart. What this indicator does is that it plots the values from the Renko Chart directly onto your main chart. So, you don't have to switch between Renko and OHLC charts anymore!
Parameters:
Renko Dots has to 2 parameters: Method & Length.
Method can be either Traditional or ATR. These are 2 different styles of Renko. Personally, I prefer ATR.
Length controls traditional Renko bar's fixed price range or controls the ATR period.
Signal Interpretation:
These Renko values are plotted as "Renko Dots" on your chart. The dots can be either green, red, or blue depending on market movements.
Green - new Renko bar (bullish)
Red - new Renko bar (bearish)
Blue - no new Renko bar (consolidation)
What is a Renko chart?
A Renko chart is a special chart that modifies a regular price chart's information about the close price and transforms it into Renko values that are plotted as Renko boxes on a chart. These boxes typically have a fixed range, say 10 pips for example. So if price moves at least 10 pips, a box is formed. Alternatively, the box's range can be set to the ATR....so in this case, each box represents a move of 1 ATR.
For more information on Renko charts, visit Investopedia.com, here's the link: investopedia.com/terms/r/renkochart.asp
Renko Dots' advantages over standard Renko chart:
- Can compare & apply it to other price charts (ohlc, candlesticks, line charts)
- Can apply it to other modified price charts (Heikin-Ashi, Renko, Line-Break)
- Can use it to trade alongside with the main chart
- Works across all instruments/markets and all time frames
- Plots consolidation (blue dots) ... (standard Renko doesn't consider time)
Enjoy :)
오픈 소스 스크립트
트레이딩뷰의 진정한 정신에 따라, 이 스크립트의 작성자는 이를 오픈소스로 공개하여 트레이더들이 기능을 검토하고 검증할 수 있도록 했습니다. 작성자에게 찬사를 보냅니다! 이 코드는 무료로 사용할 수 있지만, 코드를 재게시하는 경우 하우스 룰이 적용된다는 점을 기억하세요.
면책사항
해당 정보와 게시물은 금융, 투자, 트레이딩 또는 기타 유형의 조언이나 권장 사항으로 간주되지 않으며, 트레이딩뷰에서 제공하거나 보증하는 것이 아닙니다. 자세한 내용은 이용 약관을 참조하세요.
오픈 소스 스크립트
트레이딩뷰의 진정한 정신에 따라, 이 스크립트의 작성자는 이를 오픈소스로 공개하여 트레이더들이 기능을 검토하고 검증할 수 있도록 했습니다. 작성자에게 찬사를 보냅니다! 이 코드는 무료로 사용할 수 있지만, 코드를 재게시하는 경우 하우스 룰이 적용된다는 점을 기억하세요.
면책사항
해당 정보와 게시물은 금융, 투자, 트레이딩 또는 기타 유형의 조언이나 권장 사항으로 간주되지 않으며, 트레이딩뷰에서 제공하거나 보증하는 것이 아닙니다. 자세한 내용은 이용 약관을 참조하세요.