INVITE-ONLY SCRIPT
업데이트됨 SKYNET buy/sell 2.0
The SKYNET buy/sell 2.0 indicator generates buy and sell signals based on the following conditions:
**Anchor line : This anchor line is calculated based on certain parameters.
The anchor line is calculated in such a way that the stock/instrument moves around this anchor line.
The calculation of the anchor line uses a look back period which is set to 9 by default. The user can go to the indicator settings and change it to suit their trading style.
Note:
1) As the look back period increases, the number of signals generated on the chart decreases.
2) This indicator will only work on charts/stocks/instruments which are actually traded in the market i.e actual contracts of the stock/instrument is traded in the market. Hence, it will not work on indexes.
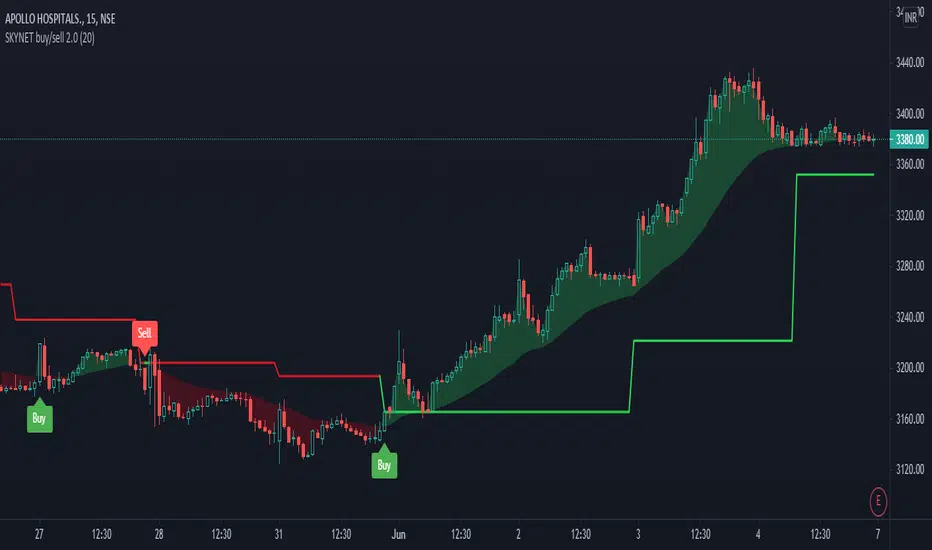
BUY signal: When the stock/instrument deviates to the upside of the anchor line by a specific margin, the Buy signal is generated.
SELL signal: When the stock/instrument deviates to the downside of the anchor line by a specific margin, the Sell signal is generated.
Disclaimer: This indicator is not 100% accurate and false signals are generated from time to time. Trading in the markets involves huge risks and one should always do his/her own research before making any trading decisions. This indicator is only designed to help you make a trading decision.
**Anchor line : This anchor line is calculated based on certain parameters.
The anchor line is calculated in such a way that the stock/instrument moves around this anchor line.
The calculation of the anchor line uses a look back period which is set to 9 by default. The user can go to the indicator settings and change it to suit their trading style.
Note:
1) As the look back period increases, the number of signals generated on the chart decreases.
2) This indicator will only work on charts/stocks/instruments which are actually traded in the market i.e actual contracts of the stock/instrument is traded in the market. Hence, it will not work on indexes.
BUY signal: When the stock/instrument deviates to the upside of the anchor line by a specific margin, the Buy signal is generated.
SELL signal: When the stock/instrument deviates to the downside of the anchor line by a specific margin, the Sell signal is generated.
Disclaimer: This indicator is not 100% accurate and false signals are generated from time to time. Trading in the markets involves huge risks and one should always do his/her own research before making any trading decisions. This indicator is only designed to help you make a trading decision.
릴리즈 노트
**We have changed the default value for the "Anchor line lookback period" from 9 to 20.릴리즈 노트
**The indicator has been customized to work better on longer time frames.릴리즈 노트
** The minimum value for the "Anchor line lookback" period was increased to 9.릴리즈 노트
++ Trendline has been added to filter out false signals. A buy signal is valid if it is generated above the trendline and similarly a sell signal is valid if it is generated below the trendline. If the price moves away significantly from the trendline, it indicates strong momentum in that direction.++ A time constraint has been added. The indicator script now runs between
9:30 to 1500.
릴리즈 노트
++ Minor bug fixed in the trendline code.릴리즈 노트
++ Minor bug fixed in the time constraint code.릴리즈 노트
++ Minor change in calculation of the trendline.릴리즈 노트
++ VISUAL TREND has been added to the indicator. WE can filter out false signals by using the signals and the VISUAL TREND together. The VISUAL TREND is established by using a couple of exponential moving averages with customized parameters and settings.
A buy signal is more likely to work if the VISUAL TREND is bullish.
A sell signal is more likely to work if the VISUAL TREND is bearish.
++ Time constraint has been removed to increase the efficiency of the indicator on cryptocurrency charts.
https://www.tradingview.com/x/l6SzG0sB/
초대 전용 스크립트
이 스크립트는 작성자가 승인한 사용자만 접근할 수 있습니다. 사용하려면 요청 후 승인을 받아야 하며, 일반적으로 결제 후에 허가가 부여됩니다. 자세한 내용은 아래 작성자의 안내를 따르거나 skynet970에게 직접 문의하세요.
트레이딩뷰는 스크립트의 작동 방식을 충분히 이해하고 작성자를 완전히 신뢰하지 않는 이상, 해당 스크립트에 비용을 지불하거나 사용하는 것을 권장하지 않습니다. 커뮤니티 스크립트에서 무료 오픈소스 대안을 찾아보실 수도 있습니다.
작성자 지시 사항
You can get the access to this indicator by leaving me a private message on TradingView.
Here are the links to some videos related to the indicator:
https://youtu.be/RntgcMAMnc0
면책사항
해당 정보와 게시물은 금융, 투자, 트레이딩 또는 기타 유형의 조언이나 권장 사항으로 간주되지 않으며, 트레이딩뷰에서 제공하거나 보증하는 것이 아닙니다. 자세한 내용은 이용 약관을 참조하세요.