OPEN-SOURCE SCRIPT
업데이트됨 + Rate of Change (and OBV)
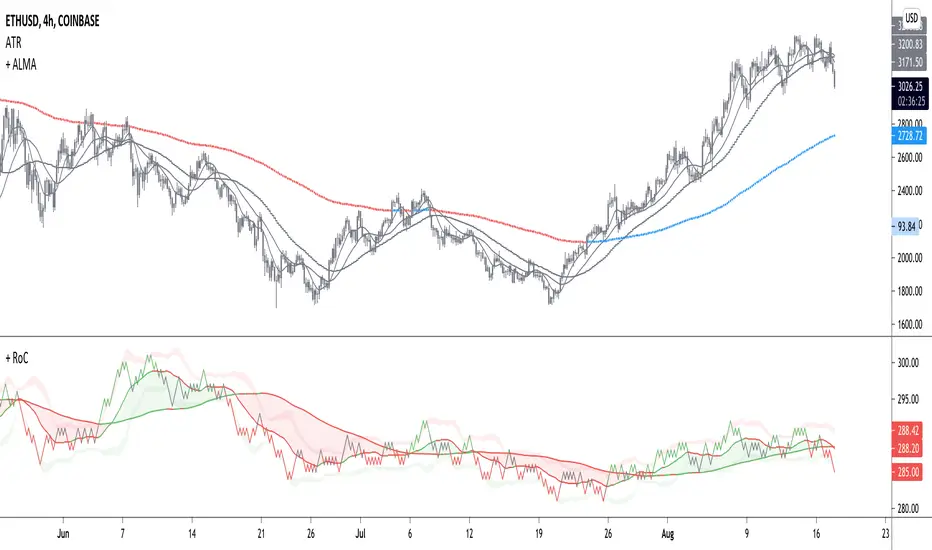
The Rate of Change, or RoC, is a momentum indicator that measures the percentage change in price between the current period and the price n periods ago. It oscillates above and below a zeroline, basically showing positive or negative momentum. I applied the OBV's calculation to it, but without the inclusion of volume (also added a lookback period) to see what would happen.
Actually what happened was I was looking at hot-rodding the OBV indicator, but then wondered if I could apply the cumulative calculation to another indicator to see what would happen. Not sure why I chose the Rate of Change, but it seemed a neat idea. And it worked! And so I called it the "Cumulative Rate of Change." I only recently realized that this is actually just the OBV without volume, HOWEVER the OBV does not have a lookback period, and its source is the close of each period. Basically, when you look at the calculation for the OBV you'll notice that it's a cumulative measure of the "change" of the closing price against the previous close times the volume. The Rate of Change is basically that measurement over more than one period, excluding the volume, and is not cumulative. Thus the "Cumulative Rate of Change" is basically an OBV without the volume but with the capability to adjust the lookback period.
Anyway, after days and weeks of playing with the indicator pretty infrequently I did decide that I actually really liked it, especially with the addition of moving averages and bollinger bands. So I decided to play with it a bit more.
I added a drop-down menu to include the standard Rate of Change indicator, and then thought I may as well add the OBV too, in case someone might like to compare that to the C-RoC, or just wants an OBV with myriad moving averages and bollinger bands.
By default I have the indicator set to the "C-RoC" and the lookback is set to 1, but play with longer settings (this is pretty much necessary if using the traditional RoC, which is by default set to 10 in TradingView, and is nigh on useless at 1).
I also recommend playing with the source. 'Close' is nice, but 'ohlc4' provides some very nice signals as well, as it follows the price flow for each period completely, filtering the noisiness of 'close' as source.
Hope you guys like this. With the bollinger bands and your preferred moving average settings this can be a powerful tool for re-entering trades in trend, taking profits, determining momentum swings.
릴리즈 노트
fixed an issue in the JMA calculation where it was only calculating off the C-ROC and no other indicators오픈 소스 스크립트
트레이딩뷰의 진정한 정신에 따라, 이 스크립트의 작성자는 이를 오픈소스로 공개하여 트레이더들이 기능을 검토하고 검증할 수 있도록 했습니다. 작성자에게 찬사를 보냅니다! 이 코드는 무료로 사용할 수 있지만, 코드를 재게시하는 경우 하우스 룰이 적용된다는 점을 기억하세요.
면책사항
해당 정보와 게시물은 금융, 투자, 트레이딩 또는 기타 유형의 조언이나 권장 사항으로 간주되지 않으며, 트레이딩뷰에서 제공하거나 보증하는 것이 아닙니다. 자세한 내용은 이용 약관을 참조하세요.
오픈 소스 스크립트
트레이딩뷰의 진정한 정신에 따라, 이 스크립트의 작성자는 이를 오픈소스로 공개하여 트레이더들이 기능을 검토하고 검증할 수 있도록 했습니다. 작성자에게 찬사를 보냅니다! 이 코드는 무료로 사용할 수 있지만, 코드를 재게시하는 경우 하우스 룰이 적용된다는 점을 기억하세요.
면책사항
해당 정보와 게시물은 금융, 투자, 트레이딩 또는 기타 유형의 조언이나 권장 사항으로 간주되지 않으며, 트레이딩뷰에서 제공하거나 보증하는 것이 아닙니다. 자세한 내용은 이용 약관을 참조하세요.