OPEN-SOURCE SCRIPT
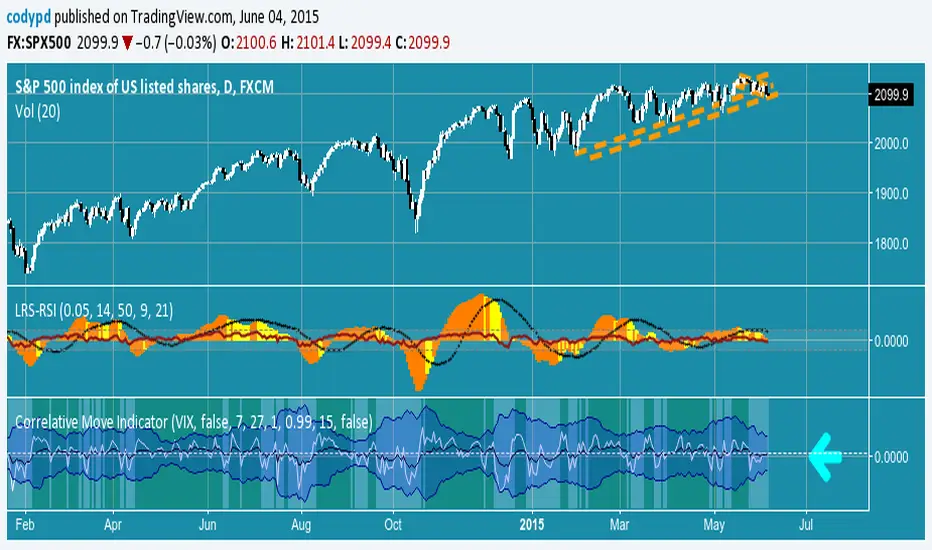
Correlative Move Indicator
EDIT: When loading this indicator it uses a default symbol for comparison of SPX. On Tradingview SPX is a Daily price (unless you buy real time) so you will see "Loading ..." and never see data. Move out to a daily time frame -or- switch the symbol to something available intraday. /EDIT
Correlates the movement of the price you are graphing to the price of someting else that you pick (default is SPX, see EDIT above)
Comments in code explain what I did. If correlations are too tight for CC to show anything but a flat line try this.
Please comment / improve.
=====================
// A simple indicator that looks complex (impress your friends)
// Provides rate of change in the propensity of something
// to move in correlation with whatever you are graphing.
// Inputs are:
// "Compared symbol" - standard Trading View symbol input. You can input ratios & formulas if you like; Defaults to SPX
// "Invert?" - by default the indicator shows the item you have charted as numerator and the "Compared symbol"
// the denominator. So if you graphed "UVXY" and open this indicator with default compared symbol "SPX" then
// the base relationship is UVXY/SPX. Click the box if you want SPX/UVXY (for example) instead.
// "Fast EMA Period" - the period for the fast EMA (white line). default = 7
// "Slow EMA Period" - the period for the slow EMA (black line). default = 27. Important: the bakground color of the indicator
// changes based on this EMA hitting threshold values below.
// "+ threshold" - > threshold for green background. default = 1.0
// "- threshold" - < threshold for red background. default = 0.99
// "BBand Period" - number of periods back for BBand (1 std deviation) calculation. default = 15
// Does not measure correlation per se - it measures change in that correlation.
// If two things do not correlate well in the first place then you will see a lot of noise
// and I wish you much luck in interpreting it.
// However, if two things do correlate well (like VXX and VIX) then this will help you detect
// circumstances where that correlation is unstable. Such instability can signal change in direction.
// I developed it to track real time changes in contango / backwardation in various VIX futures instruments which I trade.
// Tip - always try invert - sometimes the correlation changes become clearer. That can be because the threshold bias
// towards "+" with the defaults here, so think about what the "logical" relationship is and adjust the thresholds, or invert,
// or do both. Just remember - the indicator is below the item you are charting, so the default "source"/"compared"
// relationship is intuitive as you look at the screen. Volatility traders, however, will find "invert" useful with default
// thresholds signalling "green" for contango and "red" for backwardation.
// Short and long ema trends added for smoothing and trend change indications.
// Background color changes to green when correlation changing "positively" and red when "negatively" and white when near 1.
// Think of the value "1" as representing the base "1 to 1" correlation between two things. That doesn't mean same price -
// it means same rate and direction in change in price.
// 1 std deviation is used to build a basic Bollinger Band in blue. The number of periods for calculating that is an input.
// You may find a change in correlation signal outside a Bollinger Band signals a direction change. TV alerts can be
// set for such events.
오픈 소스 스크립트
트레이딩뷰의 진정한 정신에 따라, 이 스크립트의 작성자는 이를 오픈소스로 공개하여 트레이더들이 기능을 검토하고 검증할 수 있도록 했습니다. 작성자에게 찬사를 보냅니다! 이 코드는 무료로 사용할 수 있지만, 코드를 재게시하는 경우 하우스 룰이 적용된다는 점을 기억하세요.
면책사항
해당 정보와 게시물은 금융, 투자, 트레이딩 또는 기타 유형의 조언이나 권장 사항으로 간주되지 않으며, 트레이딩뷰에서 제공하거나 보증하는 것이 아닙니다. 자세한 내용은 이용 약관을 참조하세요.
오픈 소스 스크립트
트레이딩뷰의 진정한 정신에 따라, 이 스크립트의 작성자는 이를 오픈소스로 공개하여 트레이더들이 기능을 검토하고 검증할 수 있도록 했습니다. 작성자에게 찬사를 보냅니다! 이 코드는 무료로 사용할 수 있지만, 코드를 재게시하는 경우 하우스 룰이 적용된다는 점을 기억하세요.
면책사항
해당 정보와 게시물은 금융, 투자, 트레이딩 또는 기타 유형의 조언이나 권장 사항으로 간주되지 않으며, 트레이딩뷰에서 제공하거나 보증하는 것이 아닙니다. 자세한 내용은 이용 약관을 참조하세요.