PROTECTED SOURCE SCRIPT
VCCB Stocks - Volume Coloured Candle Bars
VCCB Volume Coloured Candle Bars (for Stocks, Indices, ETF, Commodities)
This indicator colour-codes the candlesticks to help traders easily identify if price action is supported by STRONG BULLISH -or- BEARISH VOLUME.
.
.
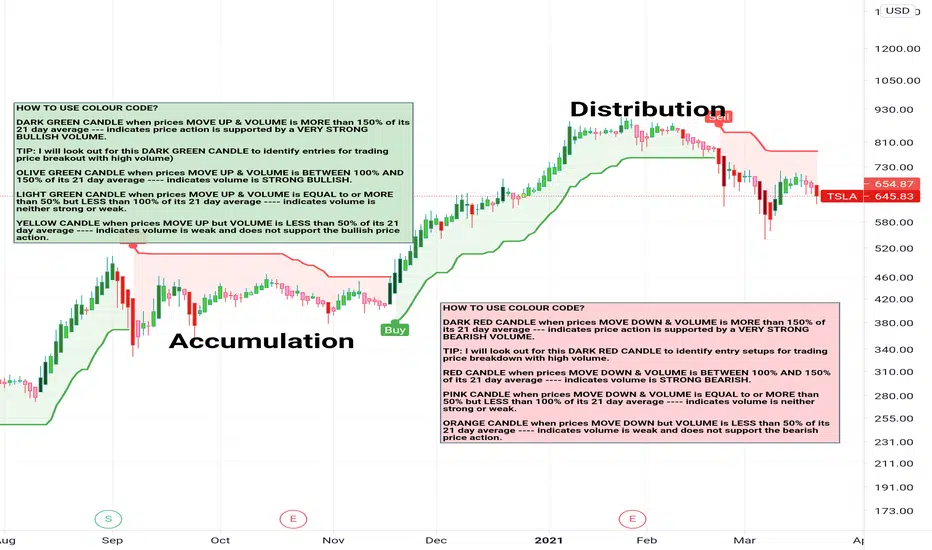
DARK GREEN CANDLE when prices MOVE UP & VOLUME is MORE than 150% of its 21 day average --- indicates price action is supported by a VERY STRONG BULLISH VOLUME.
TIP: I will look out for this DARK GREEN CANDLE to identify entries for trading price breakout with high volume)
OLIVE GREEN CANDLE when prices MOVE UP & VOLUME is BETWEEN 100% AND 150% of its 21 day average ---- indicates volume is STRONG BULLISH.
LIGHT GREEN CANDLE when prices MOVE UP & VOLUME is EQUAL to or MORE than 50% but LESS than 100% of its 21 day average ---- indicates volume is neither strong or weak.
YELLOW CANDLE when prices MOVE UP but VOLUME is LESS than 50% of its 21 day average ---- indicates volume is weak and does not support the bullish price action.
.
.
DARK RED CANDLE when prices MOVE DOWN & VOLUME is MORE than 150% of its 21 day average --- indicates price action is supported by a VERY STRONG BEARISH VOLUME.
TIP: I will look out for this DARK RED CANDLE to identify entry setups for trading price breakdown with high volume.
RED CANDLE when prices MOVE DOWN & VOLUME is BETWEEN 100% AND 150% of its 21 day average ---- indicates volume is STRONG BEARISH.
PINK CANDLE when prices MOVE DOWN & VOLUME is EQUAL to or MORE than 50% but LESS than 100% of its 21 day average ---- indicates volume is neither strong or weak.
ORANGE CANDLE when prices MOVE DOWN but VOLUME is LESS than 50% of its 21 day average ---- indicates volume is weak and does not support the bearish price action.
.
.
I recommend using this indicator in conjuction with Supertrend Indicator (that provides dynamic levels of support and resistance) to help you identify potential entry/exit points.
This indicator colour-codes the candlesticks to help traders easily identify if price action is supported by STRONG BULLISH -or- BEARISH VOLUME.
.
.
DARK GREEN CANDLE when prices MOVE UP & VOLUME is MORE than 150% of its 21 day average --- indicates price action is supported by a VERY STRONG BULLISH VOLUME.
TIP: I will look out for this DARK GREEN CANDLE to identify entries for trading price breakout with high volume)
OLIVE GREEN CANDLE when prices MOVE UP & VOLUME is BETWEEN 100% AND 150% of its 21 day average ---- indicates volume is STRONG BULLISH.
LIGHT GREEN CANDLE when prices MOVE UP & VOLUME is EQUAL to or MORE than 50% but LESS than 100% of its 21 day average ---- indicates volume is neither strong or weak.
YELLOW CANDLE when prices MOVE UP but VOLUME is LESS than 50% of its 21 day average ---- indicates volume is weak and does not support the bullish price action.
.
.
DARK RED CANDLE when prices MOVE DOWN & VOLUME is MORE than 150% of its 21 day average --- indicates price action is supported by a VERY STRONG BEARISH VOLUME.
TIP: I will look out for this DARK RED CANDLE to identify entry setups for trading price breakdown with high volume.
RED CANDLE when prices MOVE DOWN & VOLUME is BETWEEN 100% AND 150% of its 21 day average ---- indicates volume is STRONG BEARISH.
PINK CANDLE when prices MOVE DOWN & VOLUME is EQUAL to or MORE than 50% but LESS than 100% of its 21 day average ---- indicates volume is neither strong or weak.
ORANGE CANDLE when prices MOVE DOWN but VOLUME is LESS than 50% of its 21 day average ---- indicates volume is weak and does not support the bearish price action.
.
.
I recommend using this indicator in conjuction with Supertrend Indicator (that provides dynamic levels of support and resistance) to help you identify potential entry/exit points.
보호된 스크립트입니다
이 스크립트는 비공개 소스로 게시됩니다. 하지만 제한 없이 자유롭게 사용할 수 있습니다 — 여기에서 자세히 알아보기.
💡Market Trends, Investment Cycles, Trade Ideas & Concept Setups using 𝐕𝐂𝐂𝐁 𝐏𝐎𝐖𝐄𝐑 𝐓𝐑𝐄𝐍𝐃 𝐒𝐘𝐒𝐓𝐄𝐌 (𝐏𝐓𝐒).
✪ x.com/petersinguili
✪ x.com/VCCBtrader
✪ Telegram Broadcast: t.me/VCCBtrader
✪ x.com/petersinguili
✪ x.com/VCCBtrader
✪ Telegram Broadcast: t.me/VCCBtrader
면책사항
이 정보와 게시물은 TradingView에서 제공하거나 보증하는 금융, 투자, 거래 또는 기타 유형의 조언이나 권고 사항을 의미하거나 구성하지 않습니다. 자세한 내용은 이용 약관을 참고하세요.