OPEN-SOURCE SCRIPT
VWAP&EMA 10/20/60/120
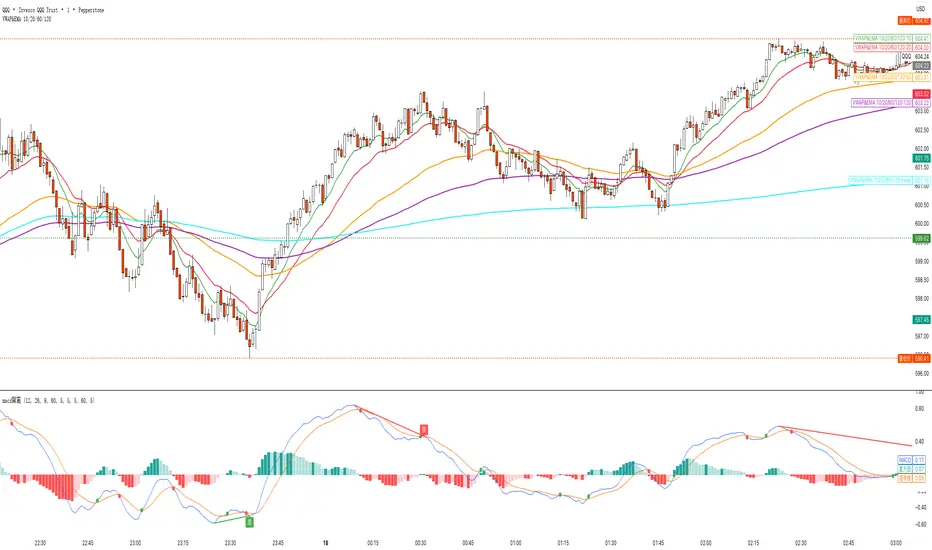
his script is a clean and straightforward technical analysis tool designed to provide traders with a clear view of market trends and key price levels by overlaying five essential moving averages onto your chart:
Volume Weighted Average Price (VWAP)
Four (4) Exponential Moving Averages (EMAs) at lengths 10, 20, 60, and 120.
By combining these indicators, traders can quickly assess short-term momentum, medium-term trends, and long-term direction, all while referencing the volume-weighted average price as a key benchmark for institutional activity.
Features & Components
This indicator plots five distinct lines on your chart, each color-coded for easy identification:
VWAP (Volume Weighted Average Price)
Plot: Plotted as a bright blue line.
Purpose: The VWAP represents the true average price of an asset for the day (or session), weighted by volume. It is a critical level for many day traders and institutions.
Prices above VWAP are often considered bullish.
Prices below VWAP are often considered bearish.
It frequently acts as a dynamic level of support or resistance.
EMA 10 (Short-Term Momentum)
Plot: Plotted as a green line.
Purpose: This is the fastest-moving average, reflecting the most recent price action and short-term momentum.
EMA 20 (Short-Term Trend)
Plot: Plotted as a red line.
Purpose: Often used in conjunction with the EMA 10, this average helps confirm the immediate trend. Crossovers between the 10 and 20 EMAs can signal potential entry or exit points.
EMA 60 (Medium-Term Trend)
Plot: Plotted as an orange line.
Purpose: This average provides a clearer picture of the medium-term trend, filtering out much of the short-term noise. It often serves as a significant dynamic support or resistance level.
EMA 120 (Long-Term Trend)
Plot: Plotted as a purple line.
Purpose: This is the slowest-moving average in the script, defining the major underlying trend. As long as the price remains above the EMA 120, the long-term bias is generally considered bullish, and vice-versa.
How to Use This Indicator
This indicator is versatile and can be adapted to various trading strategies:
Trend Confirmation: Use the alignment of the EMAs to determine the trend.
Strong Bullish Trend: Price > EMA 10 > EMA 20 > EMA 60 > EMA 120.
Strong Bearish Trend: Price < EMA 10 < EMA 20 < EMA 60 < EMA 120.
Dynamic Support & Resistance: Watch how the price reacts to each of the five lines. In an uptrend, the EMAs and VWAP will often act as "bounces" or support levels for pullbacks. In a downtrend, they will act as resistance.
Entry & Exit Signals (Crossovers):
A bullish crossover (e.g., EMA 10 crossing above EMA 20) can signal buying interest.
A bearish crossover (e.g., EMA 10 crossing below EMA 20) can signal selling pressure.
VWAP Confluence: Pay special attention to areas where an EMA (like the 20 or 60) crosses or travels close to the VWAP. This "confluence" can create a very strong and significant price level. For example, if the price pulls back to the VWAP and also finds support at the EMA 60, it can be a high-probability trade setup.
오픈 소스 스크립트
트레이딩뷰의 진정한 정신에 따라, 이 스크립트의 작성자는 이를 오픈소스로 공개하여 트레이더들이 기능을 검토하고 검증할 수 있도록 했습니다. 작성자에게 찬사를 보냅니다! 이 코드는 무료로 사용할 수 있지만, 코드를 재게시하는 경우 하우스 룰이 적용된다는 점을 기억하세요.
면책사항
해당 정보와 게시물은 금융, 투자, 트레이딩 또는 기타 유형의 조언이나 권장 사항으로 간주되지 않으며, 트레이딩뷰에서 제공하거나 보증하는 것이 아닙니다. 자세한 내용은 이용 약관을 참조하세요.
오픈 소스 스크립트
트레이딩뷰의 진정한 정신에 따라, 이 스크립트의 작성자는 이를 오픈소스로 공개하여 트레이더들이 기능을 검토하고 검증할 수 있도록 했습니다. 작성자에게 찬사를 보냅니다! 이 코드는 무료로 사용할 수 있지만, 코드를 재게시하는 경우 하우스 룰이 적용된다는 점을 기억하세요.
면책사항
해당 정보와 게시물은 금융, 투자, 트레이딩 또는 기타 유형의 조언이나 권장 사항으로 간주되지 않으며, 트레이딩뷰에서 제공하거나 보증하는 것이 아닙니다. 자세한 내용은 이용 약관을 참조하세요.