OPEN-SOURCE SCRIPT
Advanced Buy and Sell Signals
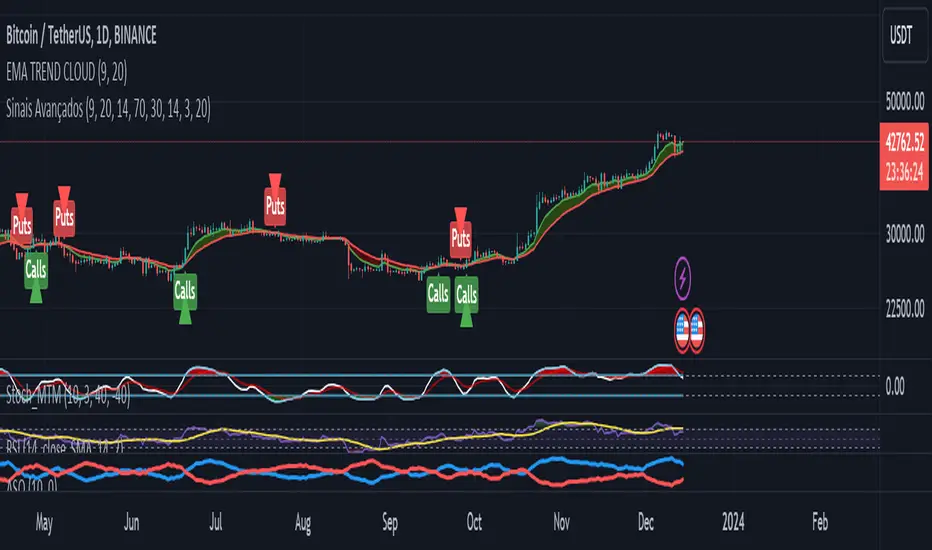
This script for TradingView is designed for technical traders seeking a more comprehensive and discerning market analysis. The script combines buy and sell signals from multiple popular technical indicators, providing a holistic view that can be useful for short to medium-term trading strategies. It incorporates the following features:
EMA Trend Cloud:
Two Exponential Moving Averages (EMAs) are calculated: a fast EMA and a slow EMA.
A "cloud" is formed on the chart, changing color as the EMAs cross, indicating potential trend shifts.
Additional Indicators:
RSI (Relative Strength Index): Used to identify overbought or oversold conditions.
Stochastic Oscillator: Helps determine the strength or weakness of the price.
OBV (On-Balance Volume) with EMA: Combines volume and price to show how volume might be influencing price direction.
Combined Buy and Sell Signals:
Buy and sell signals are generated based on a combination of the following criteria:
Crossings of the EMAs (indicative of trend changes).
Conditions of the RSI (identifying potential market extremes).
Crossings of the Stochastic Oscillator (indicating momentum).
Crossings of the OBV with its EMA (assessing the influence of volume on price movement).
Buy signals are indicated by green triangles below the price bars, while sell signals are indicated by red triangles above the price bars.
Alerts:
The script also includes alert conditions to notify the user when potential buy or sell signals are detected.
Application:
This script is suitable for traders who utilize technical analysis and seek to confirm their trading decisions with multiple sources of information. It is particularly useful in volatile markets, where the combination of different indicators can provide more reliable insights.
Note:
It is important to remember that no script or indicator can guarantee success in trading, and one should always consider risk and conduct thorough analysis before making trading decisions.
This script is most effective when used in conjunction with fundamental analysis and a solid understanding of the market.
오픈 소스 스크립트
트레이딩뷰의 진정한 정신에 따라, 이 스크립트의 작성자는 이를 오픈소스로 공개하여 트레이더들이 기능을 검토하고 검증할 수 있도록 했습니다. 작성자에게 찬사를 보냅니다! 이 코드는 무료로 사용할 수 있지만, 코드를 재게시하는 경우 하우스 룰이 적용된다는 점을 기억하세요.
면책사항
해당 정보와 게시물은 금융, 투자, 트레이딩 또는 기타 유형의 조언이나 권장 사항으로 간주되지 않으며, 트레이딩뷰에서 제공하거나 보증하는 것이 아닙니다. 자세한 내용은 이용 약관을 참조하세요.
오픈 소스 스크립트
트레이딩뷰의 진정한 정신에 따라, 이 스크립트의 작성자는 이를 오픈소스로 공개하여 트레이더들이 기능을 검토하고 검증할 수 있도록 했습니다. 작성자에게 찬사를 보냅니다! 이 코드는 무료로 사용할 수 있지만, 코드를 재게시하는 경우 하우스 룰이 적용된다는 점을 기억하세요.
면책사항
해당 정보와 게시물은 금융, 투자, 트레이딩 또는 기타 유형의 조언이나 권장 사항으로 간주되지 않으며, 트레이딩뷰에서 제공하거나 보증하는 것이 아닙니다. 자세한 내용은 이용 약관을 참조하세요.