OPEN-SOURCE SCRIPT
업데이트됨 Wick Delta Buy/Sell Pressure
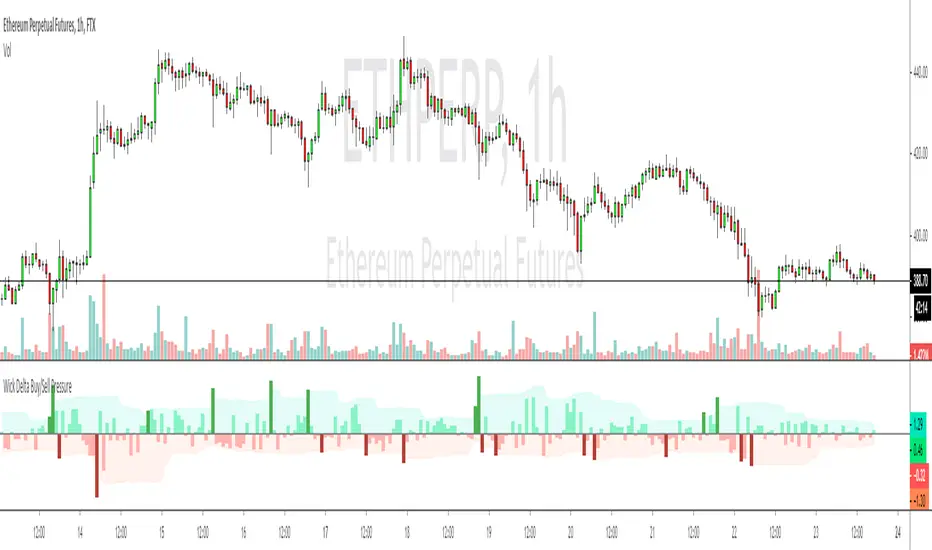
If you think of a perfect doji candle, where the wicks on top and bottom are exactly the same, that's a candle with a delta of 0. What this indicator does is show the delta/difference between wicks, if the top wick is longer than the bottom wick it show's sell pressure/bear interest, which is displayed as a red bar and vice versa for buy/bull pressure, which is shown as green bars. I added arrows for clarity.
It's a different way of visualising wicks, which can clarify sentiment and be a useful way to understand wicks better in general. One way to use it is to look for clusters of 3/4 larger bars in a row, which generally helps to determine future direction especially when seen at important levels.
It's a different way of visualising wicks, which can clarify sentiment and be a useful way to understand wicks better in general. One way to use it is to look for clusters of 3/4 larger bars in a row, which generally helps to determine future direction especially when seen at important levels.
릴리즈 노트
Updated to highlight the bigger/more important wicks오픈 소스 스크립트
트레이딩뷰의 진정한 정신에 따라, 이 스크립트의 작성자는 이를 오픈소스로 공개하여 트레이더들이 기능을 검토하고 검증할 수 있도록 했습니다. 작성자에게 찬사를 보냅니다! 이 코드는 무료로 사용할 수 있지만, 코드를 재게시하는 경우 하우스 룰이 적용된다는 점을 기억하세요.
면책사항
해당 정보와 게시물은 금융, 투자, 트레이딩 또는 기타 유형의 조언이나 권장 사항으로 간주되지 않으며, 트레이딩뷰에서 제공하거나 보증하는 것이 아닙니다. 자세한 내용은 이용 약관을 참조하세요.
오픈 소스 스크립트
트레이딩뷰의 진정한 정신에 따라, 이 스크립트의 작성자는 이를 오픈소스로 공개하여 트레이더들이 기능을 검토하고 검증할 수 있도록 했습니다. 작성자에게 찬사를 보냅니다! 이 코드는 무료로 사용할 수 있지만, 코드를 재게시하는 경우 하우스 룰이 적용된다는 점을 기억하세요.
면책사항
해당 정보와 게시물은 금융, 투자, 트레이딩 또는 기타 유형의 조언이나 권장 사항으로 간주되지 않으며, 트레이딩뷰에서 제공하거나 보증하는 것이 아닙니다. 자세한 내용은 이용 약관을 참조하세요.