OPEN-SOURCE SCRIPT
Pattern Forecast (Expo)
█ Overview
The Pattern Forecast indicator is a technical analysis tool that scans historical price data to identify common chart patterns and then analyzes the price movements that followed these patterns. It takes this information and projects it into the future to provide traders with potential price actions that may occur if the same pattern is identified in real-time market data. This projection helps traders to understand the possible outcomes based on the previous occurrences of the pattern, thereby offering a clearer perspective of the market scenario. By analyzing the historical data and understanding the subsequent price movements following the appearance of a specific pattern, the indicator can provide valuable insights into potential future market behavior.
█ Calculations
The indicator works by scanning historical price data for various candlestick patterns. It includes all in-built TradingView patterns, credit to TradingView that has coded them.
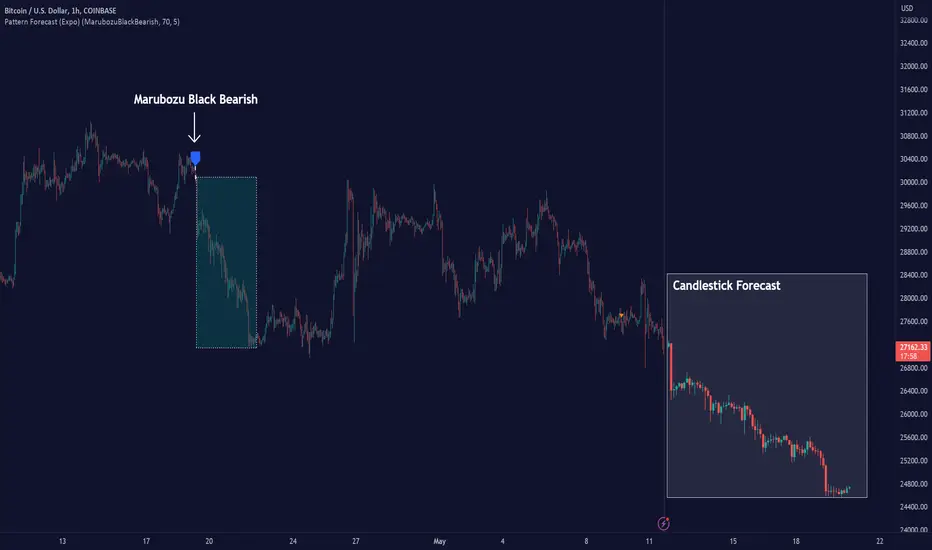
█ Example
In this example, the algorithm is set to search for the Inverted Hammer Bullish candlestick pattern. If the pattern is found, the historical outcome is then projected into the future. This helps traders to understand how the past pattern evolved over time.

█ How to use
Providing traders with a comprehensive understanding of historical patterns and their implications for future price action allows them to assess the likelihood of specific market scenarios objectively. For example, suppose the pattern forecast indicator suggests that a particular pattern is likely to lead to a bullish move in the market. A trader might consider going long if the same pattern is identified in the real-time market. Similarly, a trader might consider shorting the asset if the indicator suggests a bearish move is likely, if the same pattern is identified in the real-time market.
█ Settings
Pattern
Forecast Candles
-----------------
Disclaimer
The information contained in my Scripts/Indicators/Ideas/Algos/Systems does not constitute financial advice or a solicitation to buy or sell any securities of any type. I will not accept liability for any loss or damage, including without limitation any loss of profit, which may arise directly or indirectly from the use of or reliance on such information.
All investments involve risk, and the past performance of a security, industry, sector, market, financial product, trading strategy, backtest, or individual's trading does not guarantee future results or returns. Investors are fully responsible for any investment decisions they make. Such decisions should be based solely on an evaluation of their financial circumstances, investment objectives, risk tolerance, and liquidity needs.
My Scripts/Indicators/Ideas/Algos/Systems are only for educational purposes!
The Pattern Forecast indicator is a technical analysis tool that scans historical price data to identify common chart patterns and then analyzes the price movements that followed these patterns. It takes this information and projects it into the future to provide traders with potential price actions that may occur if the same pattern is identified in real-time market data. This projection helps traders to understand the possible outcomes based on the previous occurrences of the pattern, thereby offering a clearer perspective of the market scenario. By analyzing the historical data and understanding the subsequent price movements following the appearance of a specific pattern, the indicator can provide valuable insights into potential future market behavior.
█ Calculations
The indicator works by scanning historical price data for various candlestick patterns. It includes all in-built TradingView patterns, credit to TradingView that has coded them.
- Essentially, the indicator takes the historical price moves that followed the pattern to forecast what might happen next.
█ Example
In this example, the algorithm is set to search for the Inverted Hammer Bullish candlestick pattern. If the pattern is found, the historical outcome is then projected into the future. This helps traders to understand how the past pattern evolved over time.
█ How to use
Providing traders with a comprehensive understanding of historical patterns and their implications for future price action allows them to assess the likelihood of specific market scenarios objectively. For example, suppose the pattern forecast indicator suggests that a particular pattern is likely to lead to a bullish move in the market. A trader might consider going long if the same pattern is identified in the real-time market. Similarly, a trader might consider shorting the asset if the indicator suggests a bearish move is likely, if the same pattern is identified in the real-time market.
█ Settings
Pattern
- Select the pattern that the indicator should scan for. All inbuilt TradingView patterns can be selected.
Forecast Candles
- Number of candles to project into the future.
-----------------
Disclaimer
The information contained in my Scripts/Indicators/Ideas/Algos/Systems does not constitute financial advice or a solicitation to buy or sell any securities of any type. I will not accept liability for any loss or damage, including without limitation any loss of profit, which may arise directly or indirectly from the use of or reliance on such information.
All investments involve risk, and the past performance of a security, industry, sector, market, financial product, trading strategy, backtest, or individual's trading does not guarantee future results or returns. Investors are fully responsible for any investment decisions they make. Such decisions should be based solely on an evaluation of their financial circumstances, investment objectives, risk tolerance, and liquidity needs.
My Scripts/Indicators/Ideas/Algos/Systems are only for educational purposes!
오픈 소스 스크립트
진정한 TradingView 정신에 따라, 이 스크립트의 저자는 트레이더들이 이해하고 검증할 수 있도록 오픈 소스로 공개했습니다. 저자에게 박수를 보냅니다! 이 코드는 무료로 사용할 수 있지만, 출판물에서 이 코드를 재사용하는 것은 하우스 룰에 의해 관리됩니다. 님은 즐겨찾기로 이 스크립트를 차트에서 쓸 수 있습니다.
Join Our Free Discord: discord.gg/zeiiermantrading
Access my indicators at: linktr.ee/zeiierman_trading
Earn $15
tradingview.com/gopro/?share_your_love=Zeiierman
SMC Trading
linktr.ee/zeiierman_trading
Access my indicators at: linktr.ee/zeiierman_trading
Earn $15
tradingview.com/gopro/?share_your_love=Zeiierman
SMC Trading
linktr.ee/zeiierman_trading
면책사항
이 정보와 게시물은 TradingView에서 제공하거나 보증하는 금융, 투자, 거래 또는 기타 유형의 조언이나 권고 사항을 의미하거나 구성하지 않습니다. 자세한 내용은 이용 약관을 참고하세요.