OPEN-SOURCE SCRIPT
Solana – Daily Chart Analysis
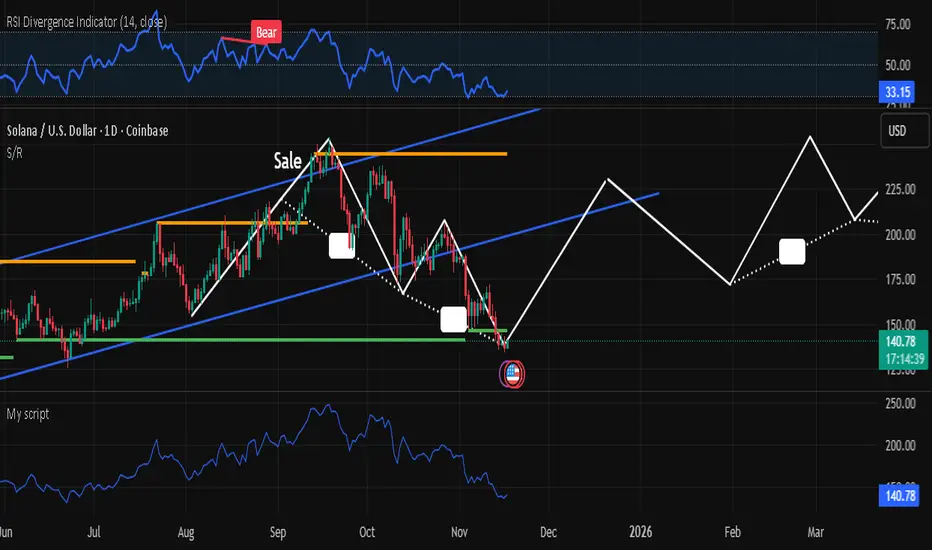
Solana is currently holding around $140 after a sharp correction from the upper channel resistance. Price is testing a key ascending trendline and horizontal support zone near $135.
📉 RSI at 32.76 signals oversold conditions, watch for potential bullish reversal setups.
🔮 Possible Path Ahead (White Projection):
• Bounce to $180 → Consolidation
• Breakout toward $240
• Target zone: $280–$300 by mid-2026
(based on channel re-entry and momentum recovery)
❗If support fails, next major demand zone sits around $100–$110.
📊 Watching closely for confirmation of trend reversal.
오픈 소스 스크립트
트레이딩뷰의 진정한 정신에 따라, 이 스크립트의 작성자는 이를 오픈소스로 공개하여 트레이더들이 기능을 검토하고 검증할 수 있도록 했습니다. 작성자에게 찬사를 보냅니다! 이 코드는 무료로 사용할 수 있지만, 코드를 재게시하는 경우 하우스 룰이 적용된다는 점을 기억하세요.
면책사항
해당 정보와 게시물은 금융, 투자, 트레이딩 또는 기타 유형의 조언이나 권장 사항으로 간주되지 않으며, 트레이딩뷰에서 제공하거나 보증하는 것이 아닙니다. 자세한 내용은 이용 약관을 참조하세요.
오픈 소스 스크립트
트레이딩뷰의 진정한 정신에 따라, 이 스크립트의 작성자는 이를 오픈소스로 공개하여 트레이더들이 기능을 검토하고 검증할 수 있도록 했습니다. 작성자에게 찬사를 보냅니다! 이 코드는 무료로 사용할 수 있지만, 코드를 재게시하는 경우 하우스 룰이 적용된다는 점을 기억하세요.
면책사항
해당 정보와 게시물은 금융, 투자, 트레이딩 또는 기타 유형의 조언이나 권장 사항으로 간주되지 않으며, 트레이딩뷰에서 제공하거나 보증하는 것이 아닙니다. 자세한 내용은 이용 약관을 참조하세요.