PROTECTED SOURCE SCRIPT
TAPLOT Enhanced On Balance Volume
Please research more on your own the different ways you can use OBV, this post is not about the indicator itself but about the “enhancements” I coded on top of this volume indicator. But here is a quick overview:
The On-Balance Volume (OBV) indicator is a technical indicator that measures the flow of positive and negative volume. The indicator adds volume on days when the price rises and subtracts it on days when the price declines.
It's considered a leading indicator because volume often leads price. An up trending OBV line is an indication of institutional accumulation.
Enhancements:
1) Dots to indicate OBV line New High (NH) and New High Before Price (NHBP).
The look back period by default is set to 3 months but could be changed to 6 or 12 months from indicator setting.
An OBV line that is making NHBP increases success probabilities of a long trade setup.
2) The OBV line changes color depending on the Up/Down Volume Ratio to quickly visualize the intensity of buying and selling pressure.
Up/Down volume ratio of 1 and above indicates buying pressure. The higher the ration the more intense is the buying and visa versa.
Here is an example of SHOP from June 2021 that has the characteristics that increase the probability of this long setup being successful.
https://www.tradingview.com/x/rNbBOE4p/
The On-Balance Volume (OBV) indicator is a technical indicator that measures the flow of positive and negative volume. The indicator adds volume on days when the price rises and subtracts it on days when the price declines.
It's considered a leading indicator because volume often leads price. An up trending OBV line is an indication of institutional accumulation.
Enhancements:
1) Dots to indicate OBV line New High (NH) and New High Before Price (NHBP).
The look back period by default is set to 3 months but could be changed to 6 or 12 months from indicator setting.
An OBV line that is making NHBP increases success probabilities of a long trade setup.
2) The OBV line changes color depending on the Up/Down Volume Ratio to quickly visualize the intensity of buying and selling pressure.
Up/Down volume ratio of 1 and above indicates buying pressure. The higher the ration the more intense is the buying and visa versa.
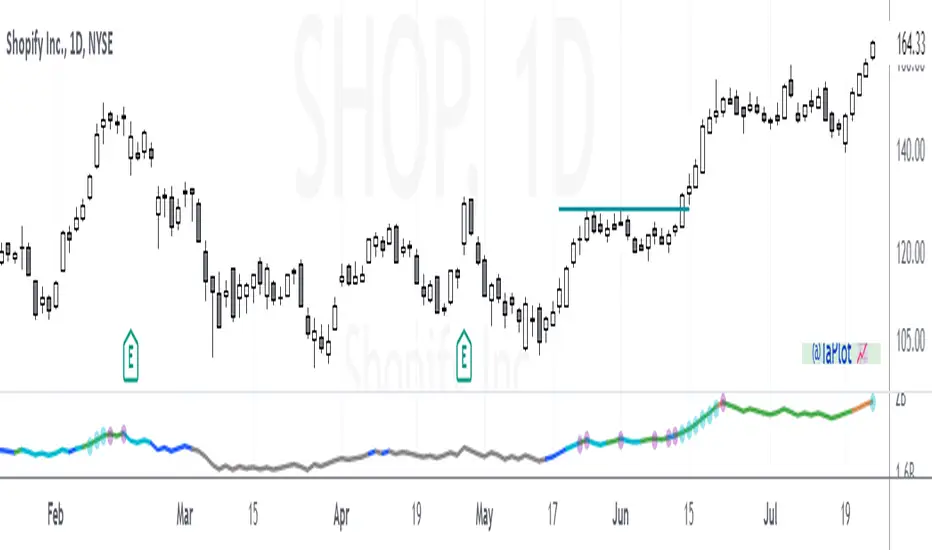
Here is an example of SHOP from June 2021 that has the characteristics that increase the probability of this long setup being successful.
- SHOP OBV turning Blue in May indicating buying pressure taking over.
- While the stock was setting up (and pulling back in June), there was 6 NHBP dots indicating stock being accumulated.
- You can also see how OBV line color goes from Blue (Buying pressure), to Cyan (Moderate buying pressure), to Green (Strong buying pressure) all while the setup is forming. Again, indicating stock being "quietly" accumulated.
https://www.tradingview.com/x/rNbBOE4p/
보호된 스크립트입니다
이 스크립트는 비공개 소스로 게시됩니다. 하지만 이를 자유롭게 제한 없이 사용할 수 있습니다 – 자세한 내용은 여기에서 확인하세요.
✔ Momentum & Breakout Trader Since 2006 | Influenced by Mark Minervini VCP Trading Style & William O'Neil CANSLIM 📈
✔ Follow me on Twitter @taplot - twitter.com/TaPlot
✔ YouTube channel youtube.com/@taplot
✔ Follow me on Twitter @taplot - twitter.com/TaPlot
✔ YouTube channel youtube.com/@taplot
면책사항
해당 정보와 게시물은 금융, 투자, 트레이딩 또는 기타 유형의 조언이나 권장 사항으로 간주되지 않으며, 트레이딩뷰에서 제공하거나 보증하는 것이 아닙니다. 자세한 내용은 이용 약관을 참조하세요.